Mixpanel: Turning User Behavior into Better Decisions
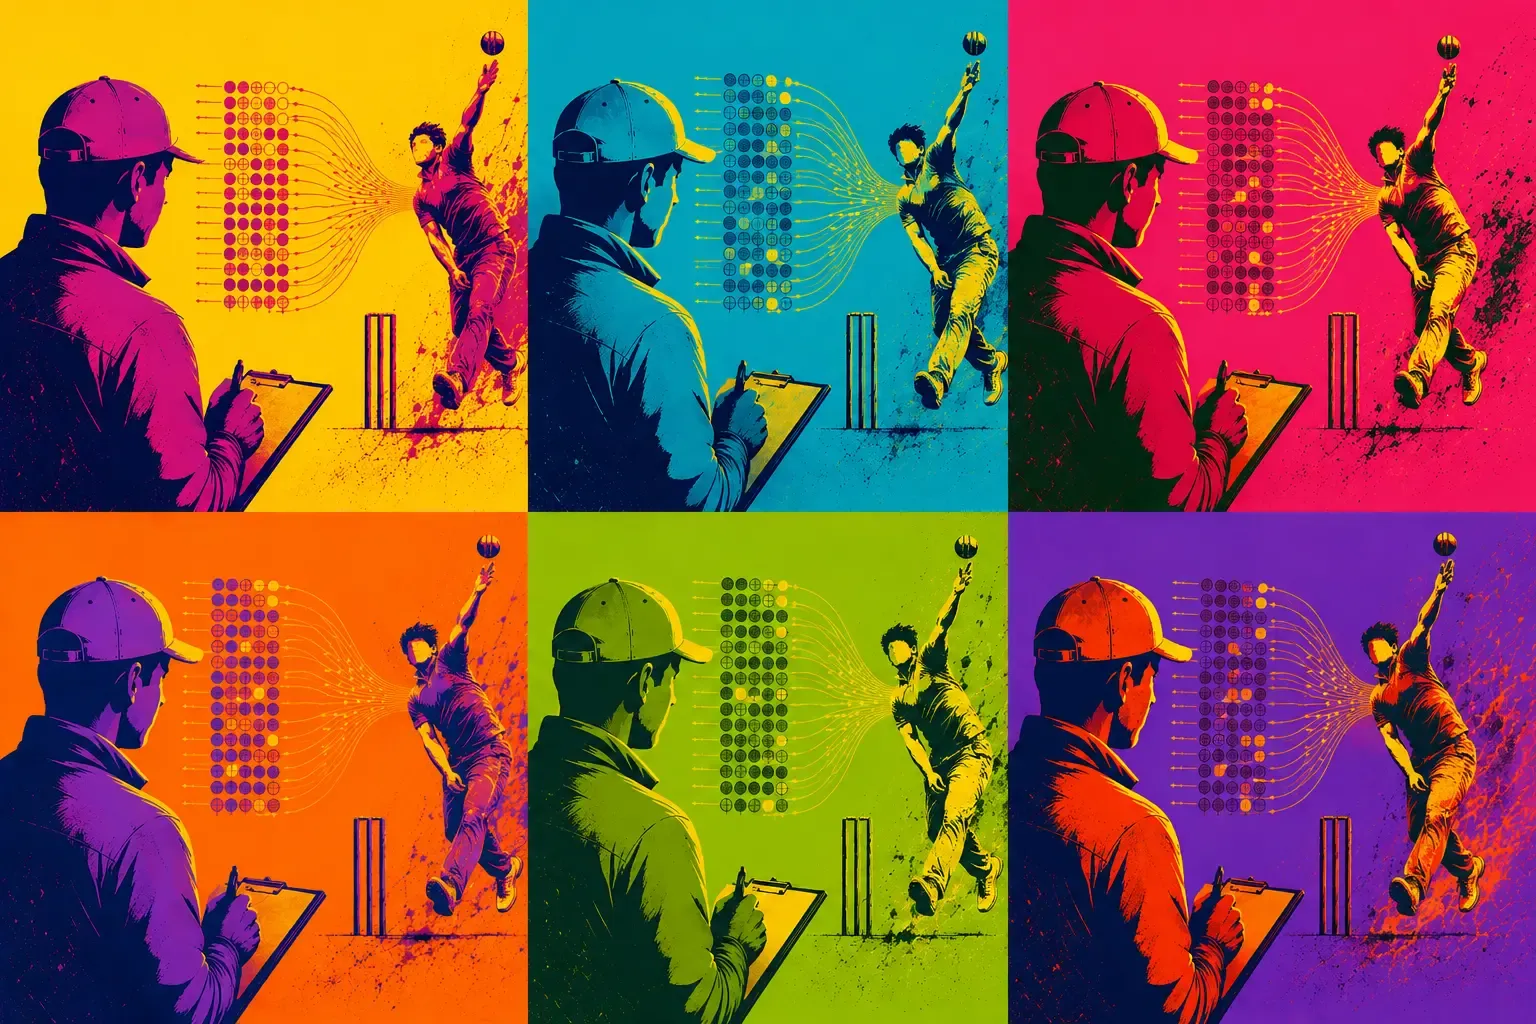
Building a product means making hundreds of decisions every week. Which feature to prioritize. Which page to simplify. Which flow is confusing users. Most teams make these decisions based on gut feeling and assumptions.
There are users. There is a product. But there is no real idea of what is happening inside it. Are people using the features that took weeks to build? Are they dropping off before completing a key action? Are certain pages being ignored entirely?
Most teams are flying blind — and do not even realize it until they stop and look.
Product Analytics
Product analytics is the practice of understanding how people use a product by tracking their actions inside it.
Think of owning a physical store — it is possible to watch customers walk in, see which shelves they browse, and notice where they stop. Now imagine having an online product with none of that visibility. You only know someone visited. Not what they did. Not where they got confused. Not why they left.
Product analytics gives that visibility back.
Why Mixpanel
Most basic analytics tools like Google Analytics tell you how many people visited a page. Mixpanel goes further — it ties every action to a specific user. Instead of knowing "100 people visited the dashboard," you know "this specific user visited the dashboard, clicked create, spent 3 minutes on the form, and left without saving."
That difference is enormous when trying to improve a product. Mixpanel also offers a free plan of up to one million events per month and takes less than an hour to set up.
What to Track
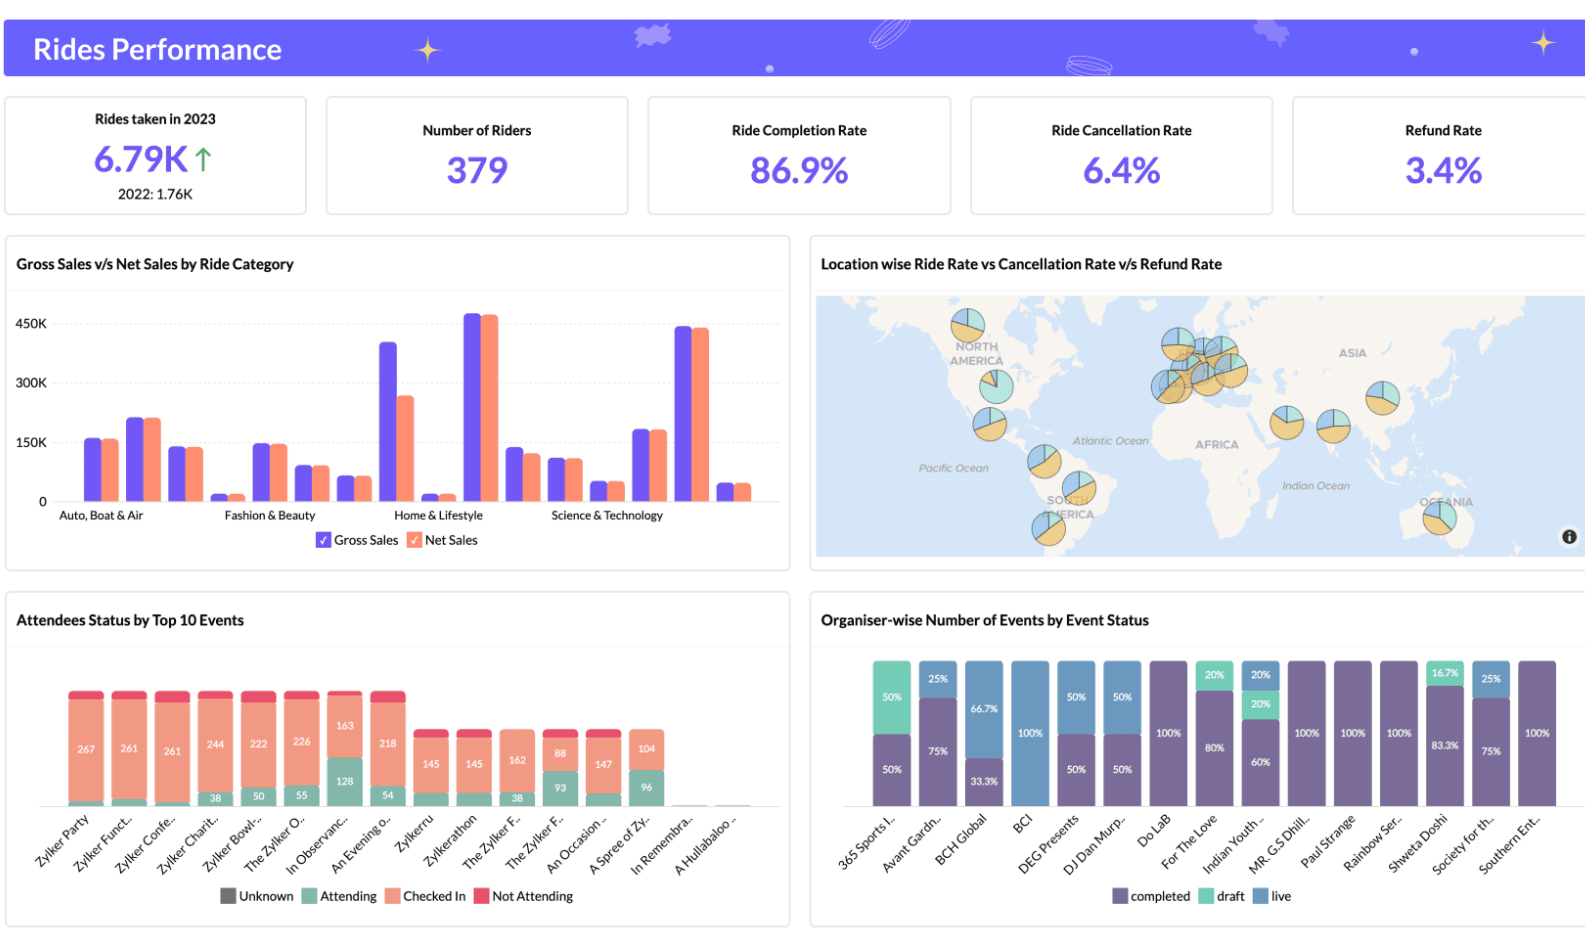
Page Visits — which pages users go to, in what order, and how long they stay. This immediately reveals which parts of the product are being used and which are ignored.
Key Actions — logins, form submissions, button clicks. Every meaningful action becomes a data point.
Scroll Depth — how far down a page users actually scroll. In many cases users never see content placed at the bottom of important pages.
Session Behaviour — how long users stay, when they are most active, and whether they return the next day.
Once set up, this data flows in continuously with nothing extra to do.
What the Data Reveals
Users are scanning, not reading.Most users act on whatever they see immediately without scrolling. This single insight changes how pages get designed.
Features are not always being discovered. Flow data often shows that users log in, visit the dashboard, and leave within two minutes without doing anything meaningful. Something is not clear enough.
Retention is more honest than expected.Most teams assume users who sign up keep coming back. The data often tells a different story.
The Features That Matter Most
Funnels show exactly where users drop off in a defined journey — turning a vague "users aren't converting" into a specific, fixable problem.
Flows show what users actually do after any given action, without predefining the steps. It is often full of surprises.
Retention answers the most important question for any product — are users coming back? If retention is low, no amount of new user acquisition will save it.
Session Replay records actual video of user sessions — every mouse movement, click, and scroll — removing all guesswork from product and design decisions entirely.
From Silent Failures to Clear Insights with Sentry
You finally check your logs, but there’s nothing useful. You try to reproduce the issue on your laptop, and everything works perfectly. That’s when it hits you—you’re debugging in the dark. The problem isn’t just bugs, it’s the lack of visibility into what your users are actually experiencing in the real world. This is where tools like Sentry make a difference. Instead of guessing, Sentry shows you exactly what went wrong, on which device, browser, and network conditions, along with the full error trace. It turns silent failures into actionable insights, so you can catch issues early, fix them faster, and stop losing users without even knowing why.
Sentry is an error monitoring tool. Here's what that means.
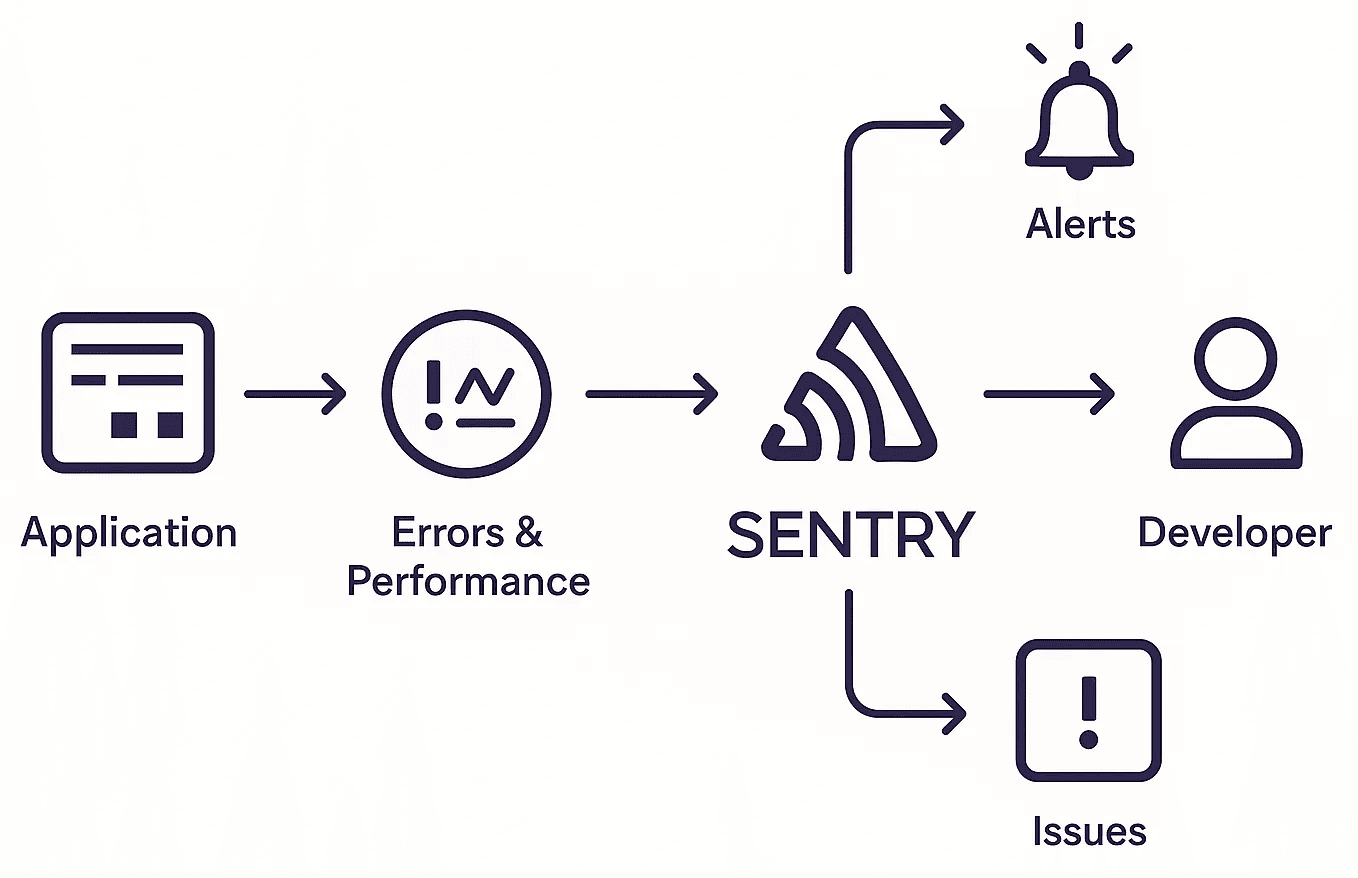
You add a small piece of code to your app (called the Sentry SDK). It runs silently in the background. When something goes wrong — a JavaScript error, a Python exception, a crashed server request — Sentry catches it and sends a detailed report to your Sentry dashboard.
You wake up, open your dashboard, and see exactly what broke, when, for which users, and why.
Sentry captures things like: the exact error message, the line of code that caused it, what the user was doing right before it happened, their browser, their device, their location, and much more.
Sentry doesn't fix bugs for you. It tells you about them — fast, with enough detail that you actually can fix them.
The three things Sentry shows you
- ● The error message - The actual text of what went wrong. Like "Cannot read property 'name' of undefined" — the same error your browser console shows, but captured automatically even when no developer is watching.
- ● The stack trace - A breadcrumb trail of code calls that led to the crash. Think of it as rewinding the tape to see exactly which function called which function right before things exploded.
- ● The context - What was the user doing? Which page were they on? What browser, what OS, what screen size? This is often the difference between "I can't reproduce this" and "oh, it only breaks on Safari."
With Sentry :
- ● User hits a bug
- ● Sentry captures everything
- ● You get an alert immediately
- ● You see exactly what went wrong
- ● You fix it before it spreads
Words you'll see in Sentry — explained simply
- ● Issue - A group of similar errors. If 50 users hit the same bug, Sentry groups them into one Issue instead of 50 separate alerts. Makes your dashboard manageable.
- ● Event -A single occurrence of an error. One issue can have thousands of events — each event is one user hitting the bug. The issue is the "what", events are the "how many times."
- ● Stack Trace - The chain of function calls that led to the crash. Like a GPS history — it shows every turn your code took before it drove off a cliff.
- ● Breadcrumbs - A timeline of what happened right before the error — button clicks, page navigations, API calls. Sentry records these automatically so you can replay the user's journey.
- ● DSN (Data Source Name) — your project's unique URL. You paste this into your app to tell Sentry "send errors here." Don't share it publicly.
- ● Environment - A tag that tells Sentry where the error happened — "production" (real users), "staging" (testing), "development" (your laptop). Lets you filter out test noise from real alerts.
- ● Source Maps - JavaScript in production is compressed and unreadable. Source maps translate it back to your original readable code in Sentry. Without them, stack traces look like gibberish.
Final Thoughts
At the end of the day, users don’t care why your app broke—they only remember that it did. Every silent failure is a missed opportunity, a lost user, or revenue you’ll never get back. The difference between a good app and a reliable one is visibility, and that’s exactly what Sentry gives you. It helps you move from reacting to problems to preventing them, from guessing to knowing. Instead of finding out weeks later that something went wrong, you can catch issues the moment they happen and fix them before they impact more users. Because shipping your app isn’t the finish line—it’s where real monitoring begins.