Data visualization and storytelling are critical for making sense of today’s data-rich world. Whether you’re an analyst, a researcher, or a business leader, translating raw data into actionable insights often hinges on effective tools. Two innovative platforms that elevate this process are Microsoft’s LIDA and our RAG-enhanced data visualization platform using gen AI, AI Fortune Cookie. While LIDA specializes in refining and enhancing infographics, Fortune Cookie transforms disparate datasets into cohesive dashboards with the power of natural language prompts. Together, they form a powerful combination for visual storytelling and data-driven decision-making.
What You Need to Know About Microsoft LIDA
Microsoft’s LIDA (Language-Integrated Data Analytics) is a cutting-edge tool designed for automating and refining the creation of data visualizations and infographics.
With its seamless integration of machine learning and natural language processing, LIDA makes the data visualization process more intuitive, even for users without deep technical expertise.
Key Features of LIDA for Infographics
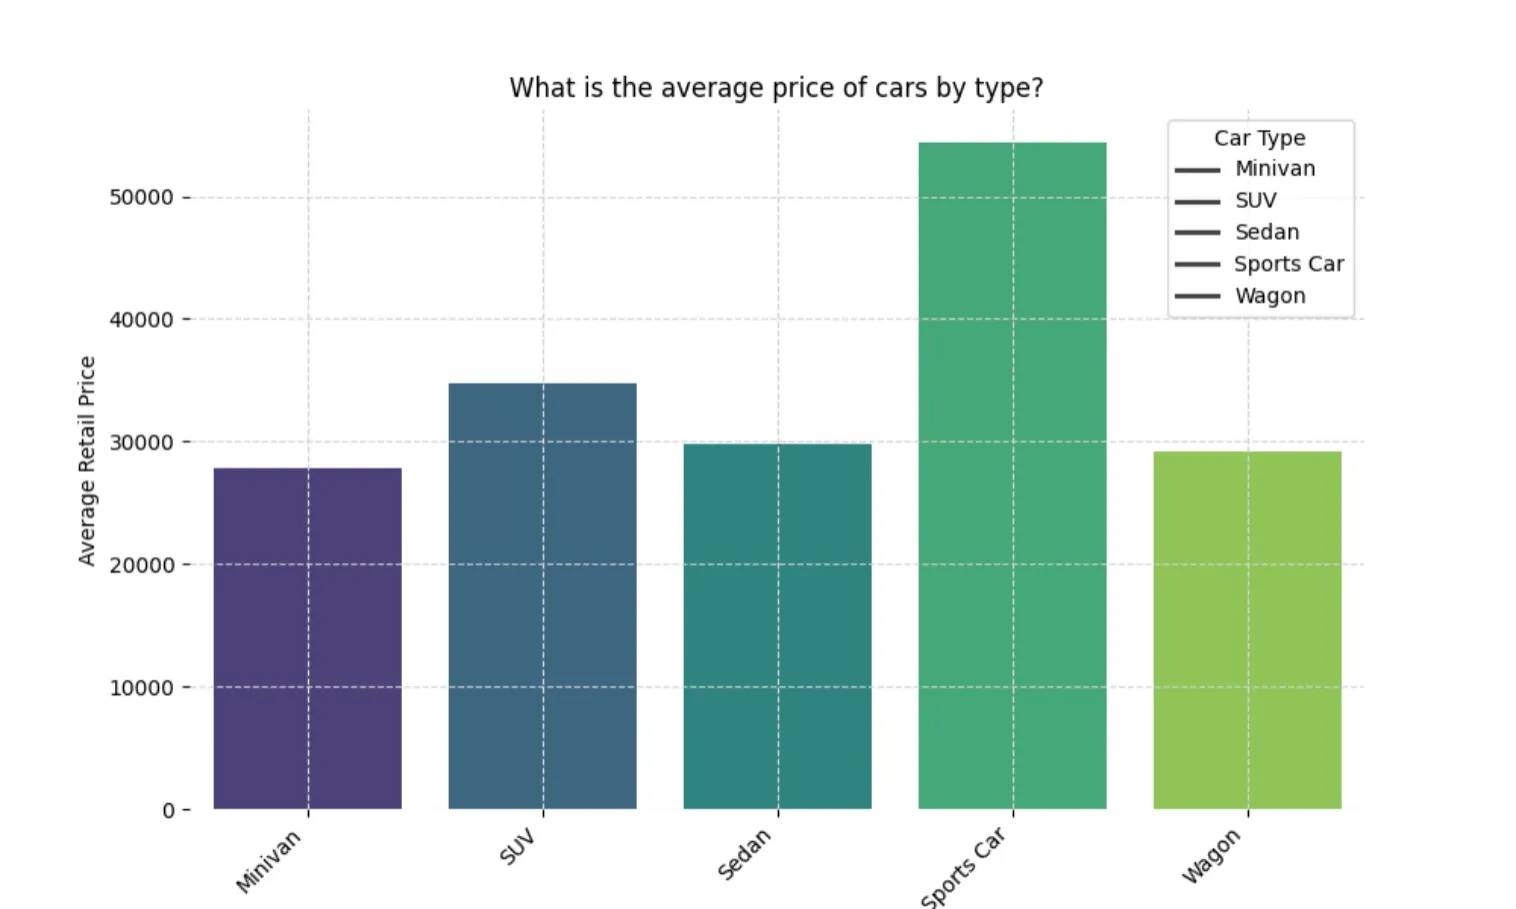
Natural Language Queries: LIDA allows users to interact with datasets using natural language. For instance, querying, “What is the average price of cars by type?” automatically generates relevant data visualizations.
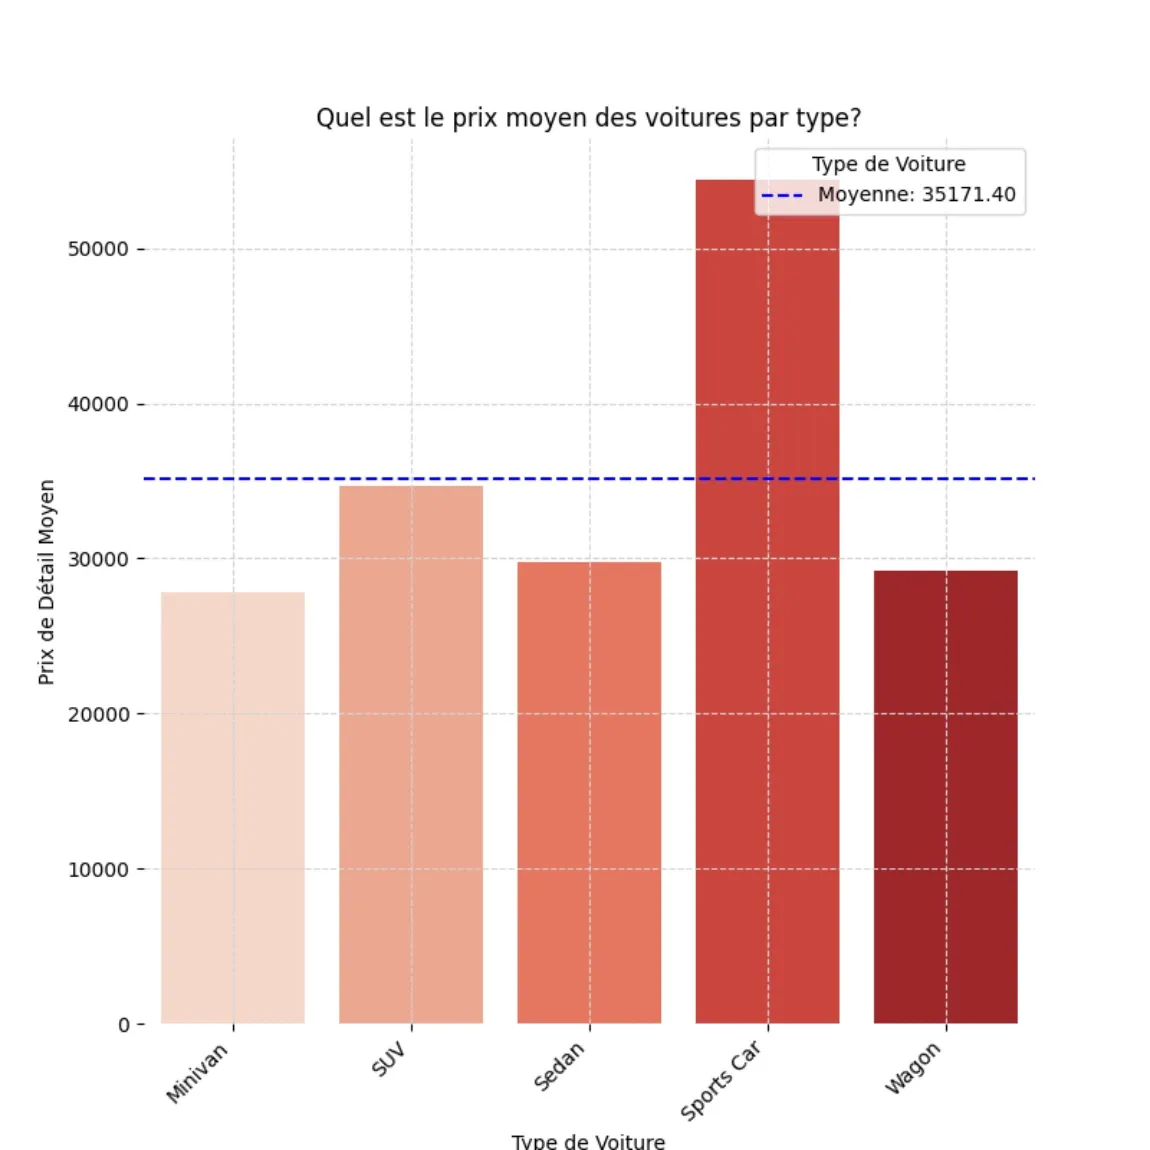
Customization Options: Through its editing capabilities, LIDA allows users to refine data visualizations with prompts such as "convert to French," "adjust chart height and width," or "apply a pastel theme."
Infographic Generation: The Infographer module uses style prompts (e.g., “modern minimalist” or “pastel art”) to render polished, publication-ready graphics.
Code Recommendations and Explanations: LIDA generates data visualizations and provides detailed code recommendations and explanations, empowering users to understand and modify the underlying code.
LIDA in Action
Here’s a typical use case for LIDA:
Dataset Summary: Load a dataset, such as car sales data, and generate a summary. For example: "The dataset contains the metadata such as car types, prices, and origins."
Query Visualization: When you ask a query like, “What is the average price of cars by origin?”, LIDA produces a relevant chart.
Refine Data Visualizations: Use instructions like "translate labels to French" or "apply a green color scheme" and the tool refines the visualization.
By combining automation with customization, LIDA accelerates the path from raw data to impactful data visuals.
An Inside Look at Fortune Cookie
Fortune Cookie is a data visualization tool powered by generative AI and Retrieval-Augmented Generation (RAG), designed to produce reports by combining data from unstructured and structured datasets. Unlike traditional dashboard tools, Fortune Cookie harnesses the power of large language models (LLMs) to allow users to query dashboards using conversational prompts.
Key Features of Fortune Cookie
Multi-Table Querying: Fortune Cookie can seamlessly pull data from multiple tables and datasets to produce unified data visualizations.
Prompt-Driven Dashboards: Users can generate dashboards with simple conversational prompts like, "Show me sales trends by region over the last quarter."
Voice and Text Interaction: Ask questions about your data via text or voice, and Fortune Cookie will respond with visual or textual answers.
Dynamic Updates: As new data becomes available, Fortune Cookie automatically updates dashboards and reports to reflect the latest information.
AI-Enhanced Insights: Beyond data visualizations, Fortune Cookie provides predictive analytics and trends based on historical data.
Fortune Cookie in Action
Imagine you’re managing agricultural commodity trading, where data is scattered across sales reports, market trends, and weather forecasts. Here’s how Fortune Cookie analyzes and visualizes this data in action.
Load Datasets: Upload sales, market, and weather data to Fortune Cookie Google Sheets, CSV, or Excel formats are supported.
Query Dashboard: You can ask, "What’s the impact of pests and rainfall on crop yields this season for cotton?"
Unified View: Fortune Cookie retrieves relevant data, analyzes relationships, and presents an interactive dashboard showing trends and correlations.

The Value of These Tools for Modern Enterprises
For data analysts in enterprises, LIDA streamlines the creation of visually compelling and accurate infographics, transforming raw data into clear, impactful visuals, while Fortune Cookie enables seamless exploration of complex datasets with intuitive interfaces. For business leaders, these tools offer unified dashboards and refined data visualizations, empowering faster, data-driven decisions and enhancing data visualization through professional-grade infographics. Developers benefit from LIDA’s robust code explanations and customizable recommendations for fine-tuning data visualizations, while Fortune Cookie’s prompt-based interactions eliminate the need for manual SQL queries or intricate setups, significantly reducing effort and accelerating workflows. Together, these tools bridge the gap between data complexity and actionable insights, ensuring smoother collaboration across roles.
In today’s data-driven world, data visualization tools like Microsoft’s LIDA and Fortune Cookie redefine how we interact with, visualize, and present data. LIDA excels at refining infographics and enabling customization, while Fortune Cookie shines in integrating and querying multiple datasets for dynamic dashboards. Together, they provide the complete picture: from raw data to actionable insights, beautifully visualized.
Whether you’re an analyst seeking precision, a leader needing clarity, or a developer looking for automation, LIDA and Fortune Cookie offer the tools to take your data storytelling to the next level. To learn more about Fortune Cookie, contact us at Random Walk and our AI experts are ready to provide a personalized demo tailored to your unique business needs.