The Random Walk Blog

2025-01-18

YOLOv8, YOLO11 and YOLO-NAS: Evaluating Their Strengths on Custom Datasets

YOLOv8, YOLO11 and YOLO-NAS: Evaluating Their Strengths on Custom Datasets

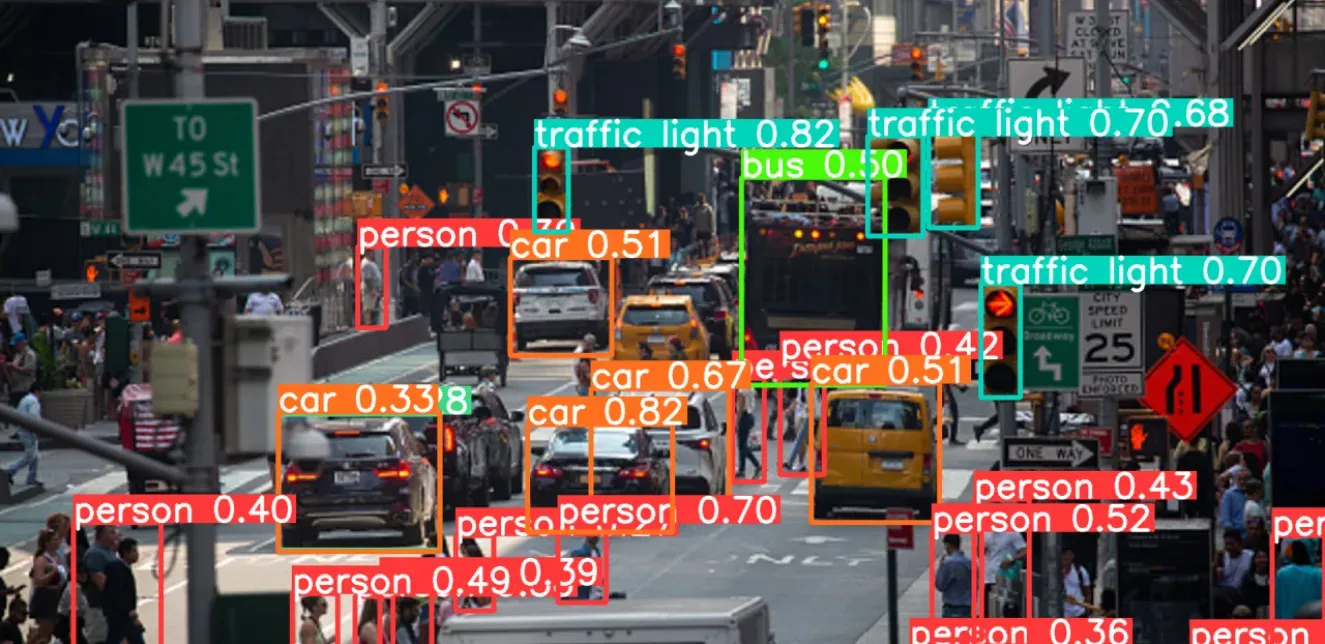
It might evade the general user’s eye, but object detection is one of the most used technologies in the recent AI surge, powering everything from autonomous vehicles to retail analytics. And as a result, it is also a field undergoing extensive research and development. The YOLO family of models have been at the forefront of this since the publication of the research paper You Only Look Once: Unified, Real-Time Object Detection in 2015, which introduced object detection as a regression problem rather than a classification problem (an approach that governed most prior work), making object detection faster than ever. YOLO v8 and YOLO NAS are two widely used variations of the YOLO, while YOLO11 is the latest iteration in the Ultralytics YOLO series, gaining popularity.

YOLO v8 is a state-of-the-art model created by Ultralytics as a successor to their YOLO v5; capable of object detection, image classification and instance segmentation tasks. YOLO 11, also developed by Ultralytics builds upon the advancements made by previous versions and brings significant improvements in the architecture. YOLO NAS is a development by Deci AI (now acquired by NVIDIA) based on their advanced Neural Architecture Search (NAS) technology, which brings improvements in quantization support and accuracy-latency trade-offs. The large-scale (L) models of YOLOv8, YOLO11 and YOLO-NAS claim mAP values of 52.9, 53.4, 52.22 respectively when pretrained on the COCO dataset with 328K images across 80 classes.

A comparison of models is a logical step in choosing which fits your use case better. Here, we have trained the large (L) scale variants of YOLOv8, YOLO11 and YOLO-NAS from random initializations on a custom vehicle dataset of 16847 images across 4 classes (auto, car, heavy-vehicle, two-wheeler) including augmentations for 100 epochs to draw up a fair comparison. The dataset consists of images gathered from the COCO dataset, the internet and live footage from sites of interest. The dataset was created specifically to deal with the vehicle types found on Indian roads.

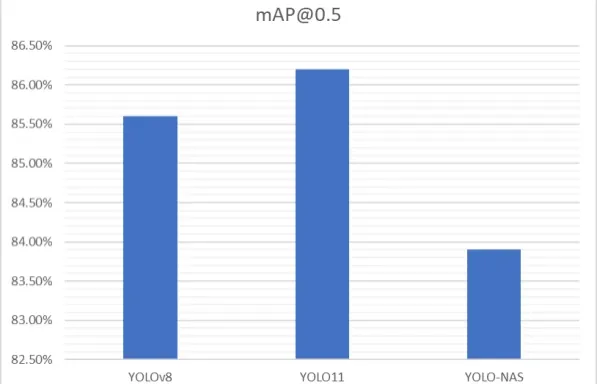
Mean Average Precision (mAP)

mAP measures how well a model detects objects by comparing the model's predicted bounding boxes to the ground truth annotations. The mAP scores for the models after training:

YOLO mAP1.webp

Source: Random Walk

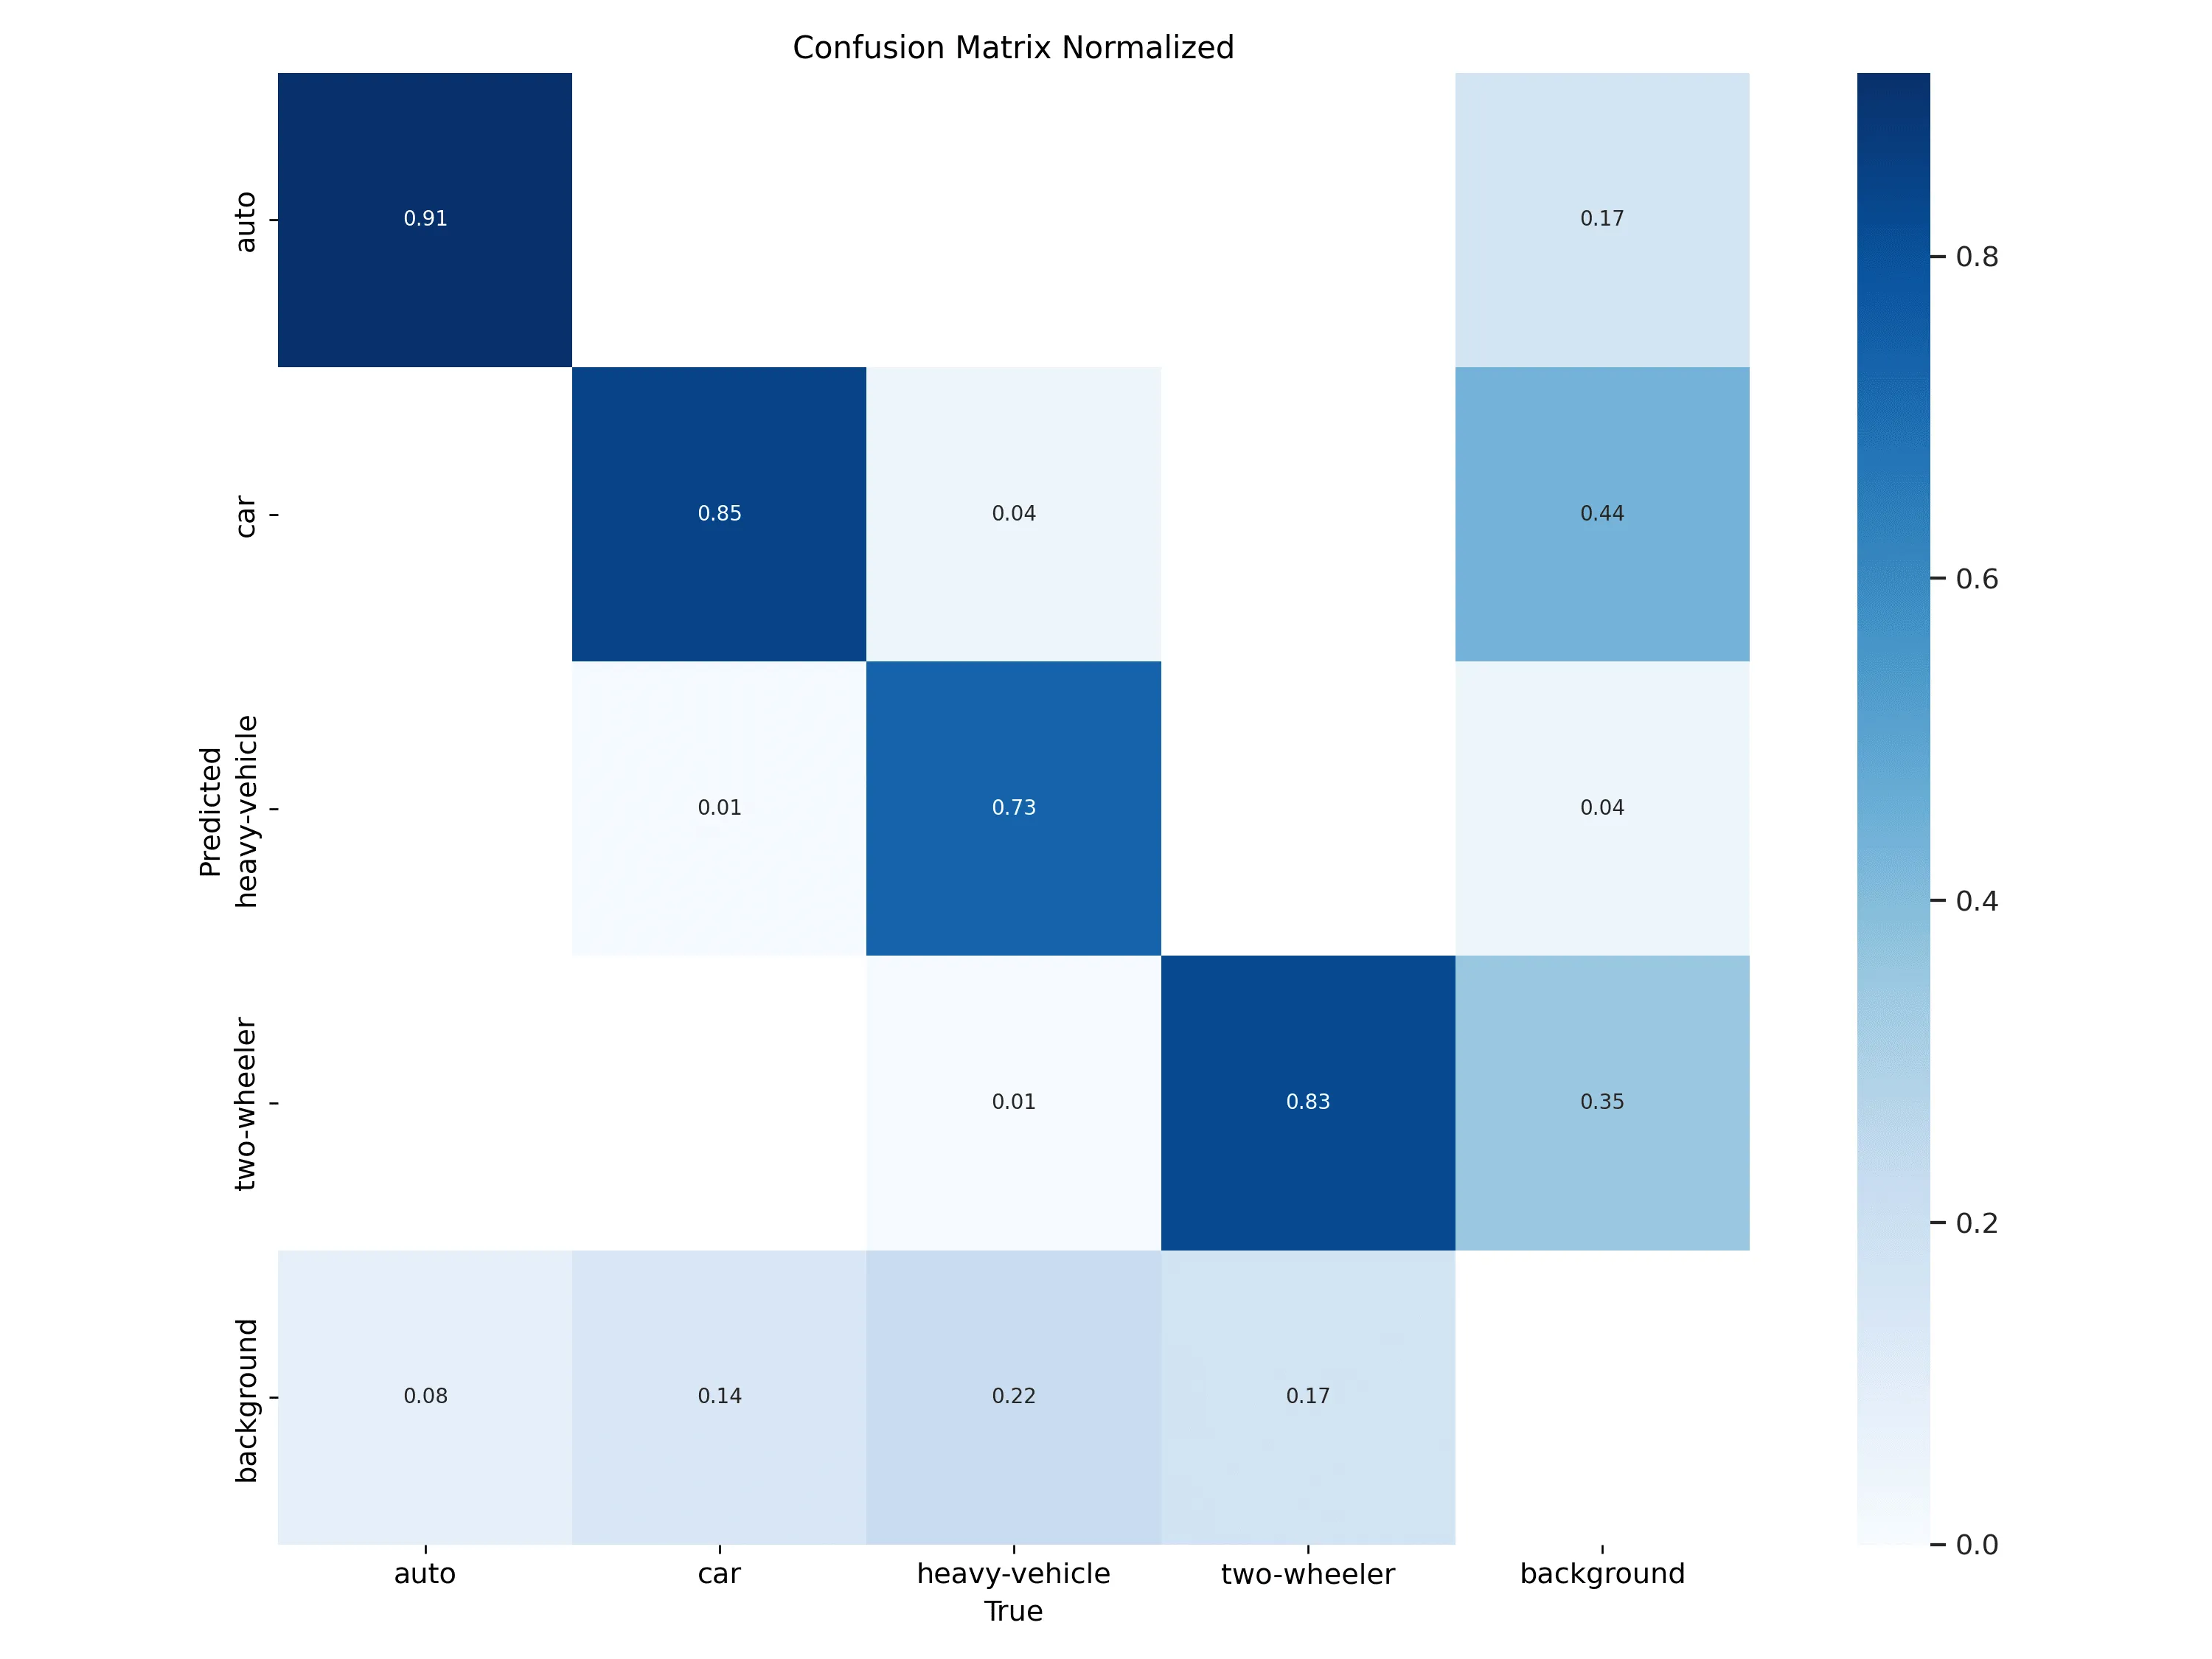
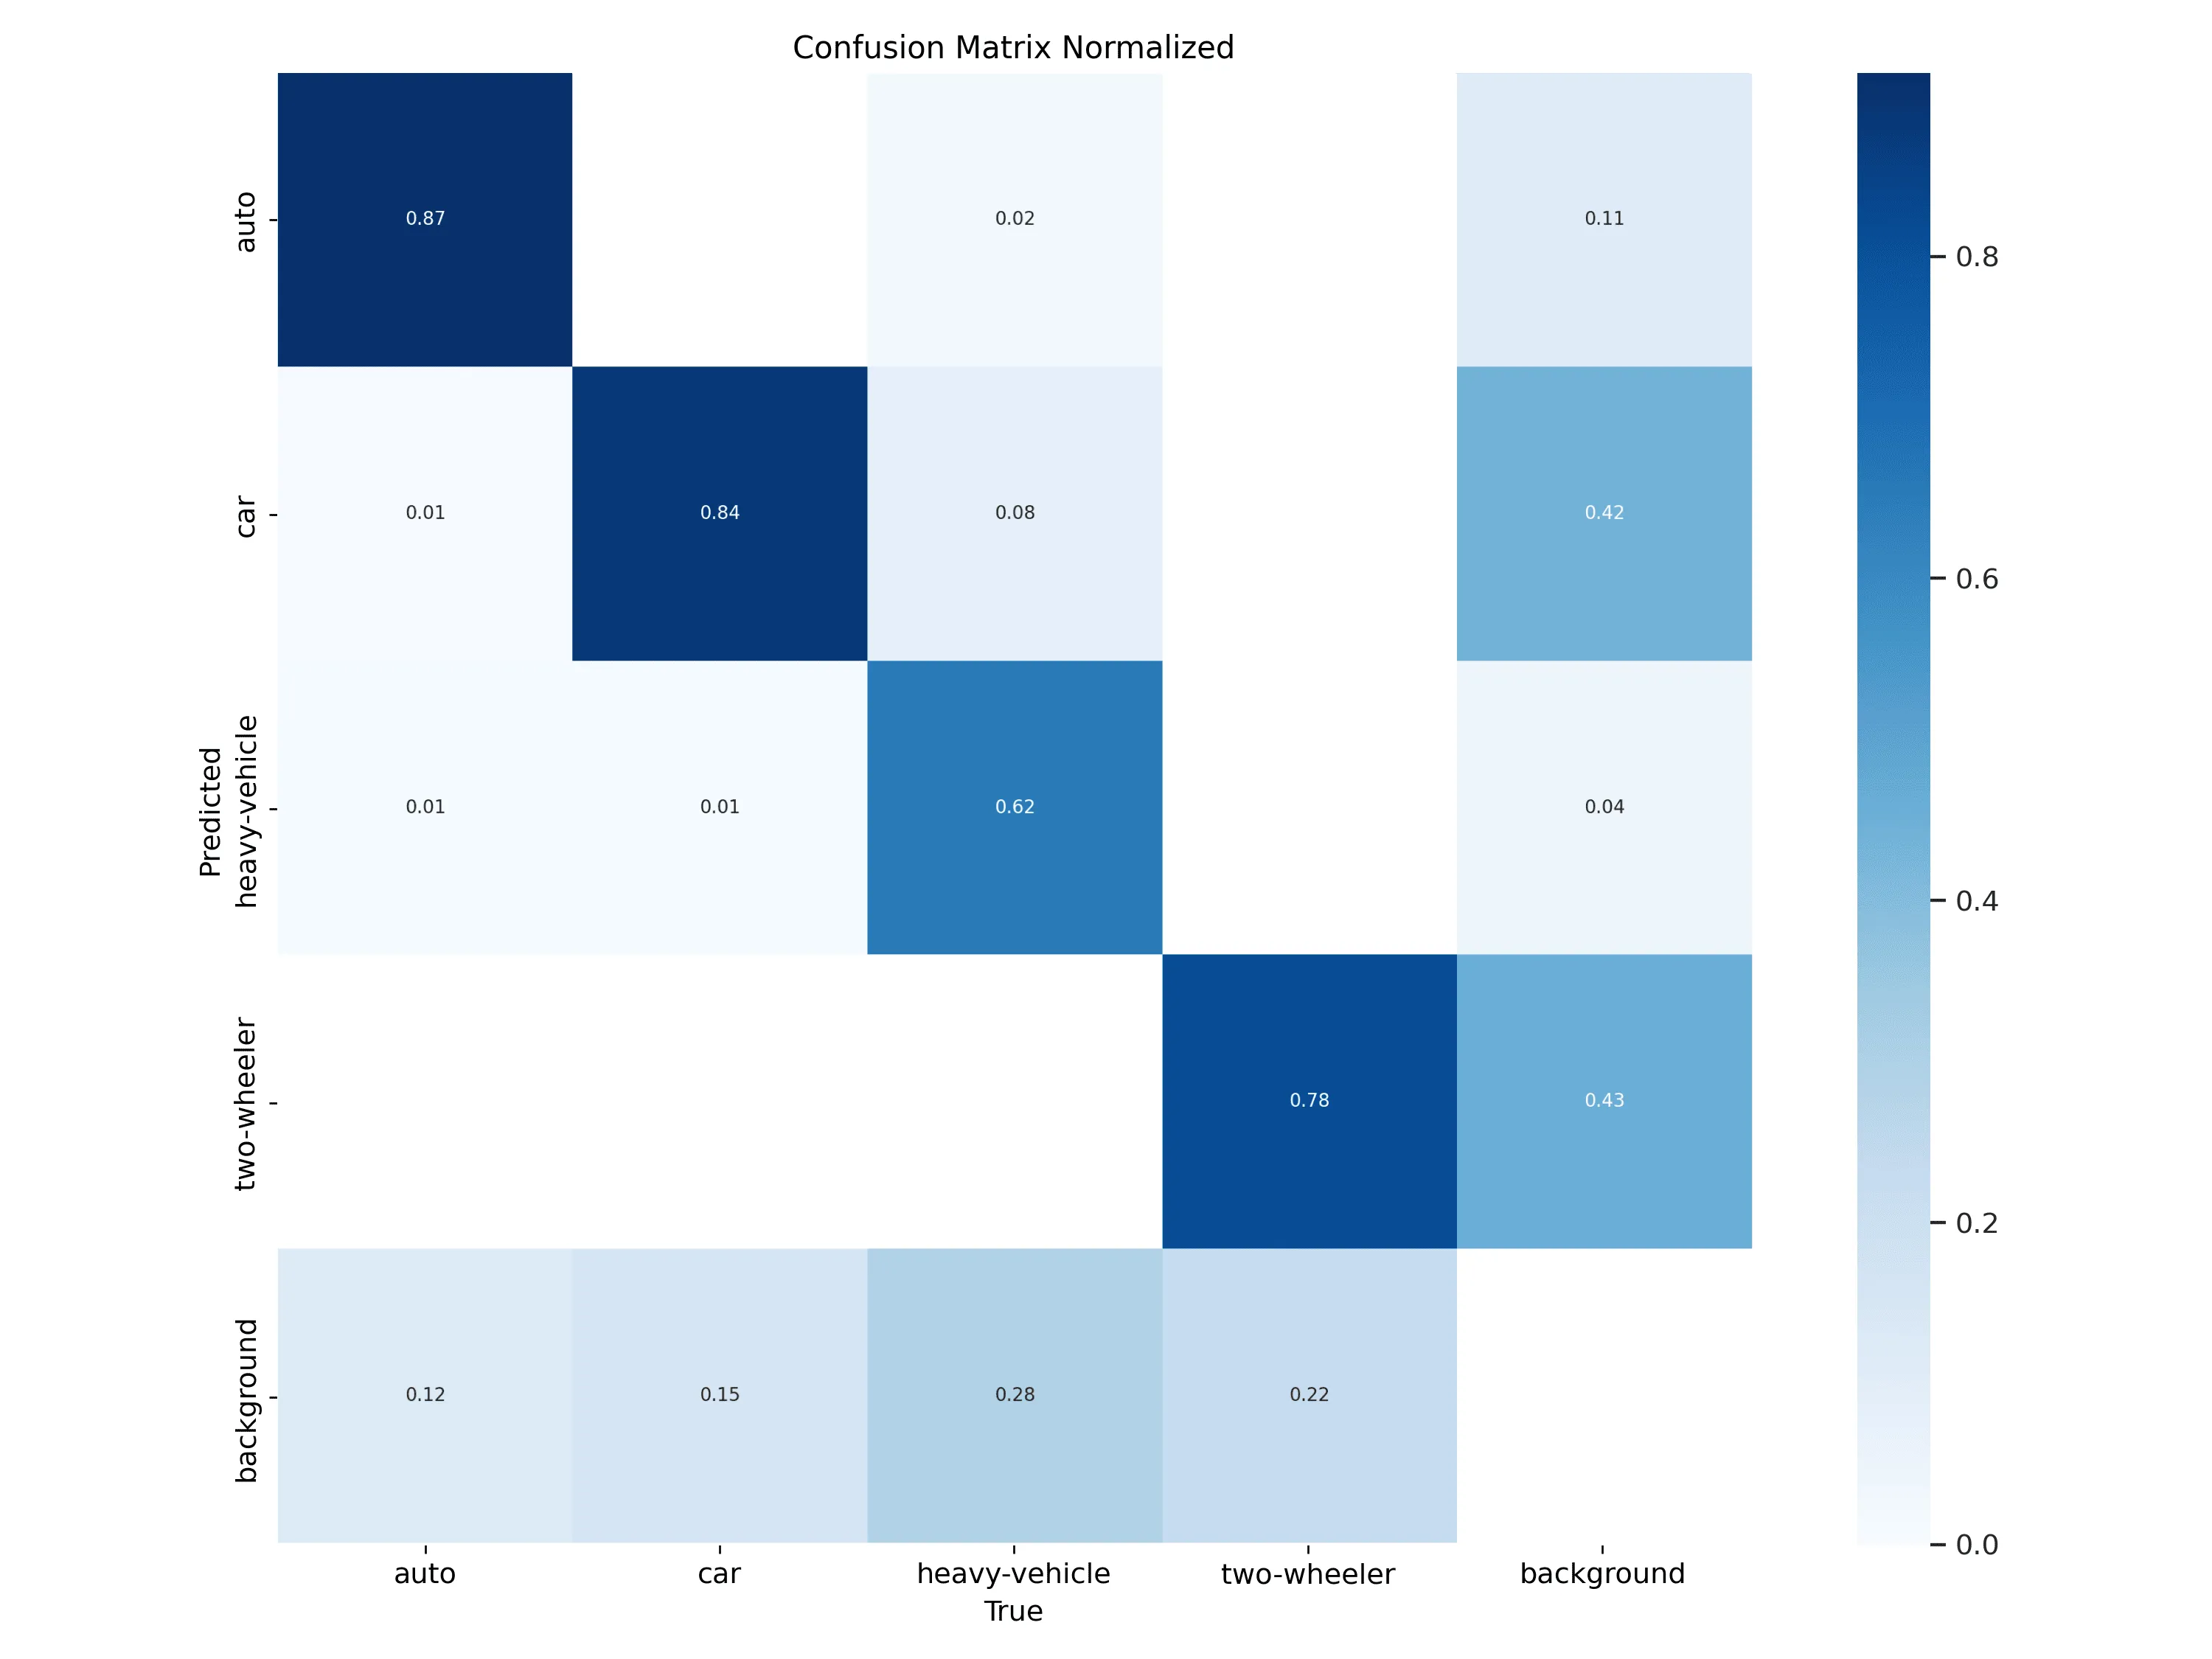
Normalized Confusion Matrix

A confusion matrix is a fundamental tool in classification problems, providing insight into the performance of a classification model against a test set. It displays the true positive, false positive, true negative, and false negative predictions, giving a detailed view of how well the model is performing across different classes.

True Positives: The boxes along the top-left to the bottom-right diagonal represent the true positives, i.e., the predictions that were correct.

Ghost Detections: The last column shows the instances where the model detected objects when there were none.

False Negatives: The last row of the matrix represents false negatives, where objects were not detected even when they were present.

Misdetections: The rest of the boxes of the matrix are misdetections, i.e., an object detected as a wrong class.

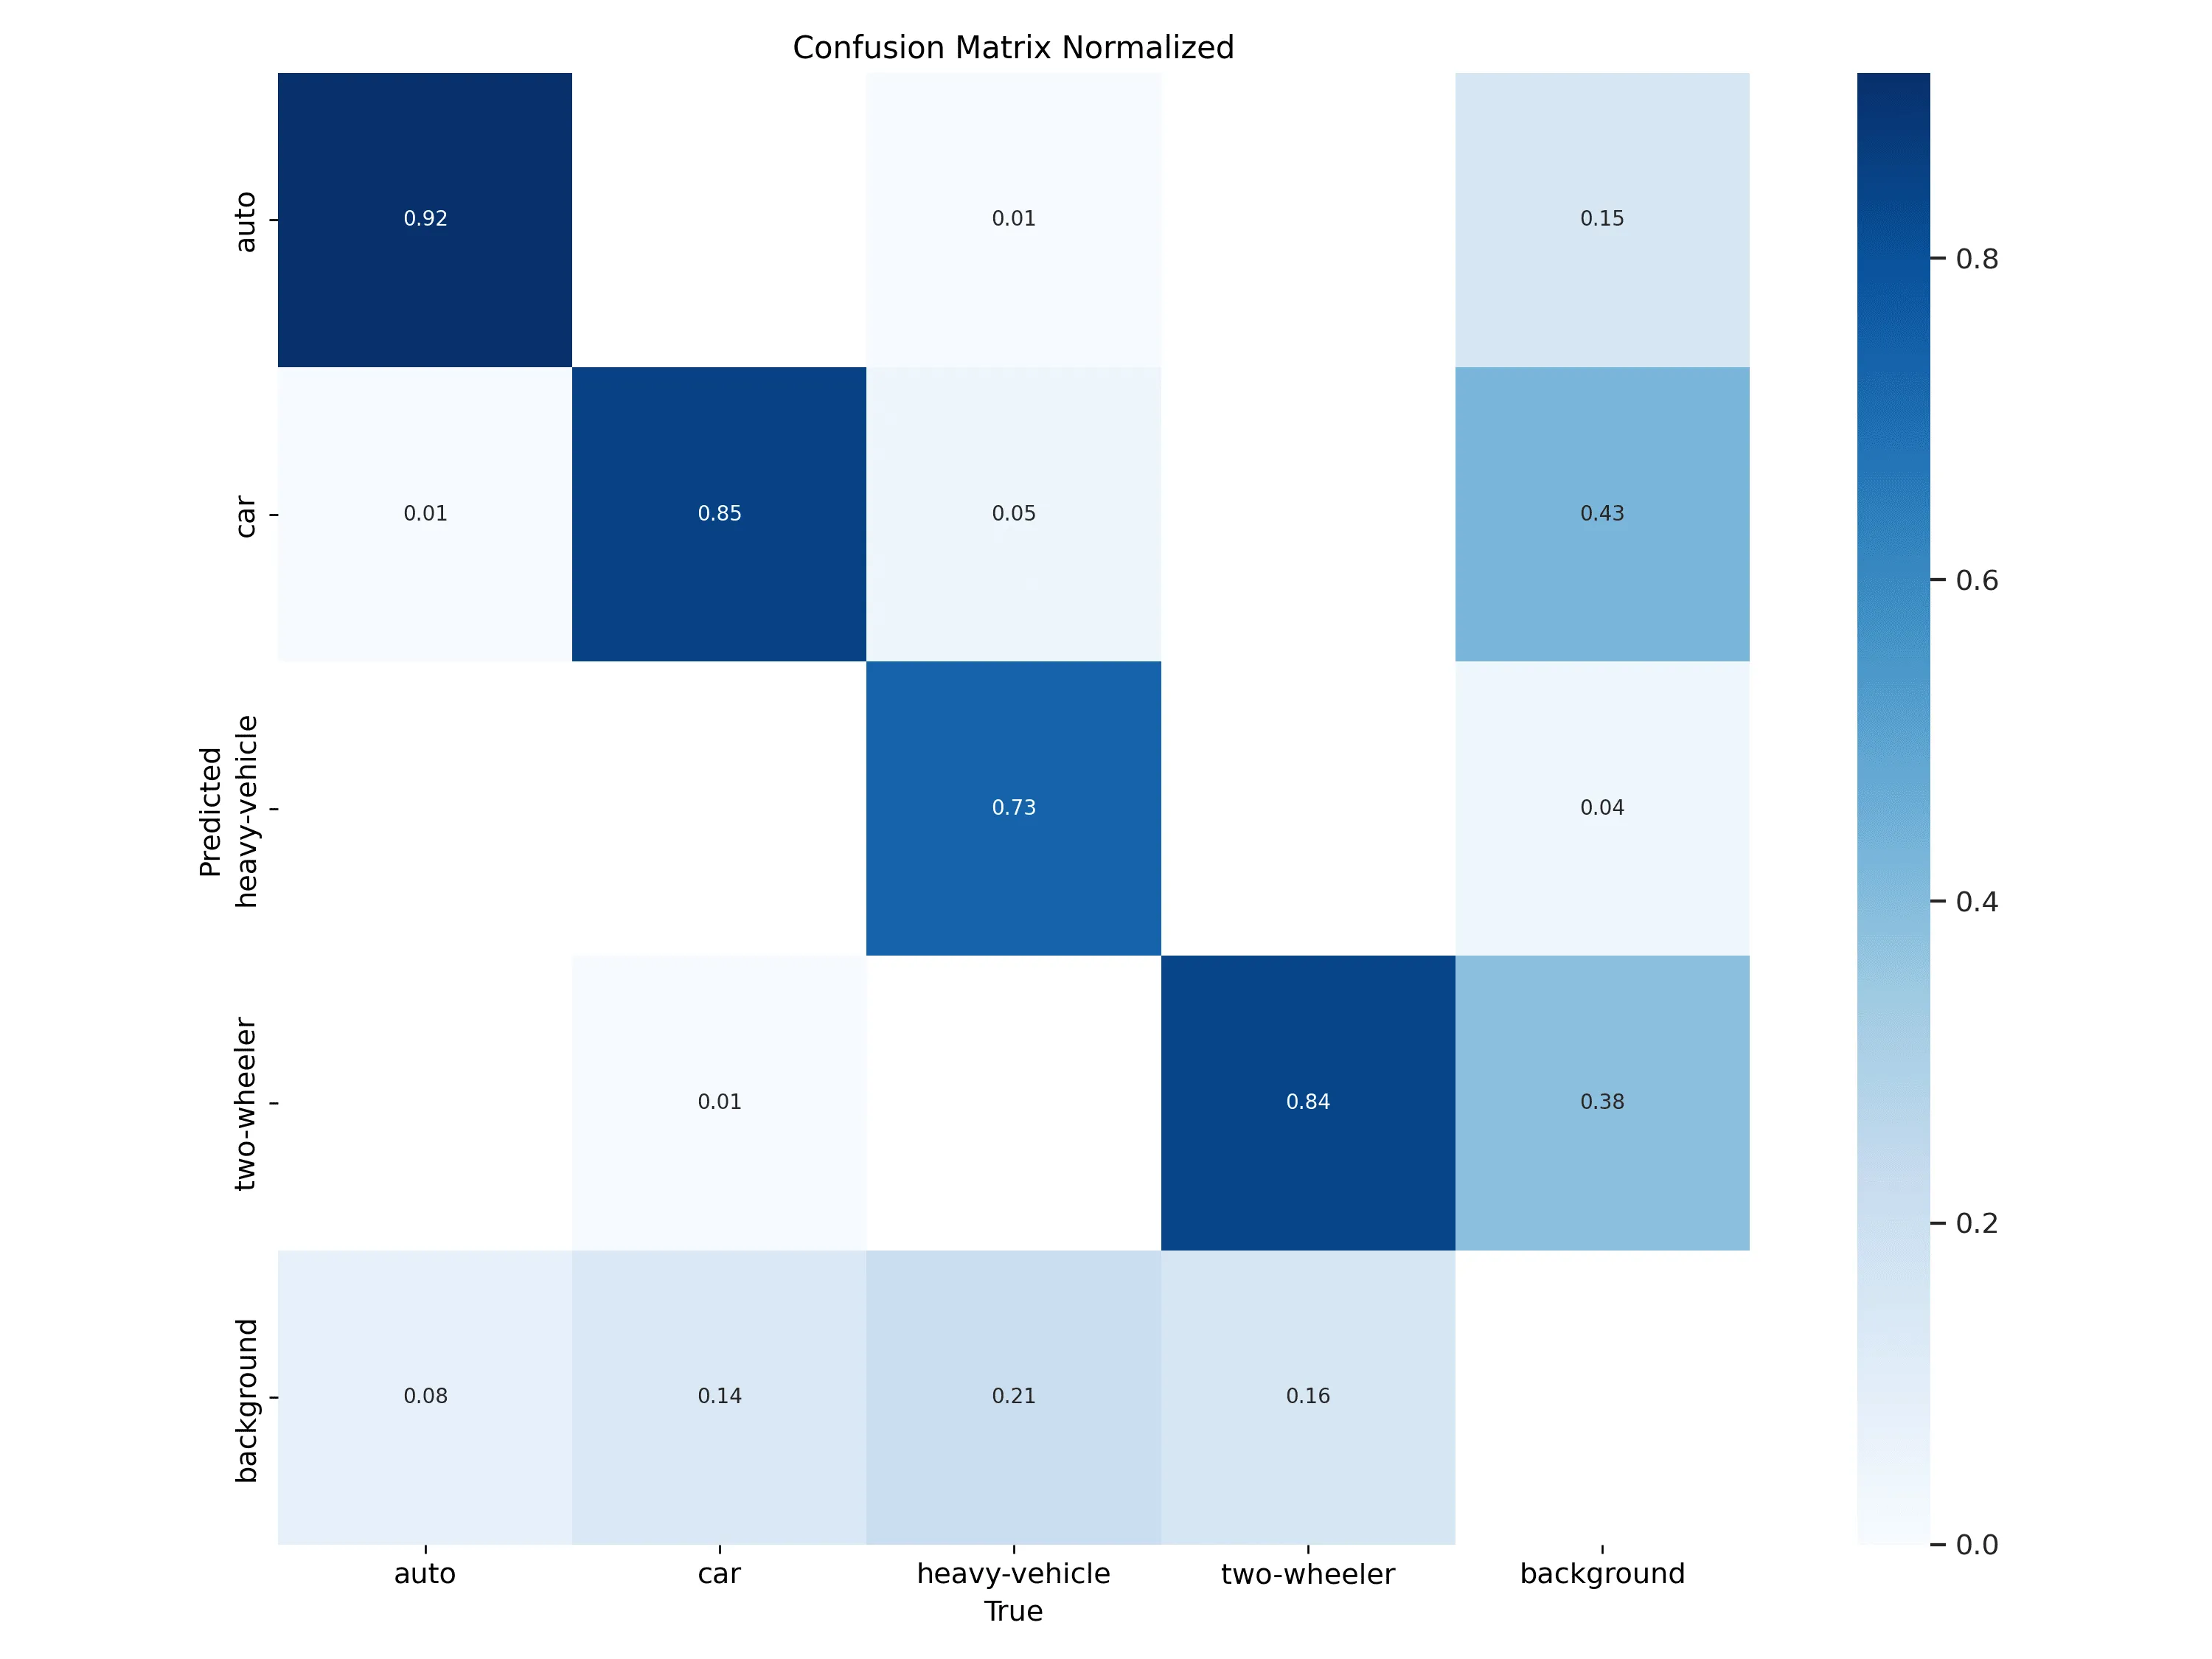
Given below are the confusion matrices for YOLOv8, YOLO11, YOLO-NAS.

YOLOv8

YOLOv8-CM.webp

YOLO11

YOLO11-CM.webp

YOLO-NAS

YOLO-NAS-CM.webp

Source: Random Walk

Inference from the Confusion Matrix

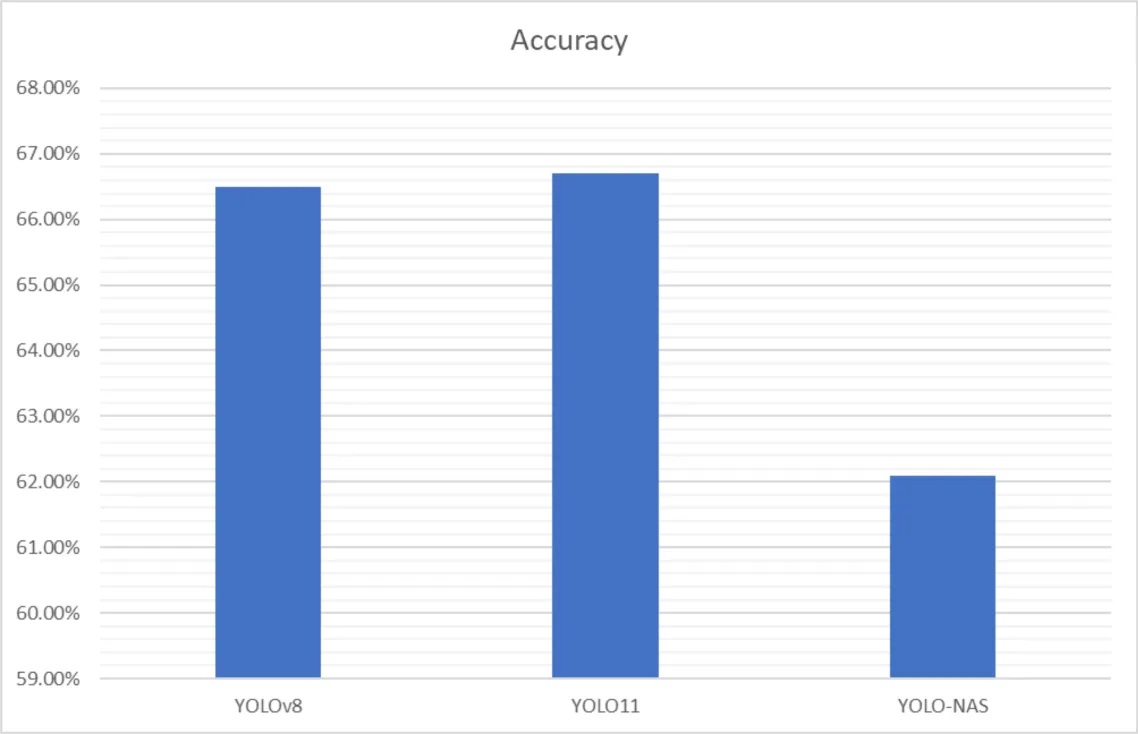
Accuracy: Accuracy is defined as the ratio of correct predictions to the total number of predictions. It can be calculated from the confusion matrix as:

Accuracy = Trace(CM) / Sum(CM), where CM is the confusion matrix

The accuracies of the models trained have been shown below.

YOLO-model-accuracy-.webp

Source: Random Walk

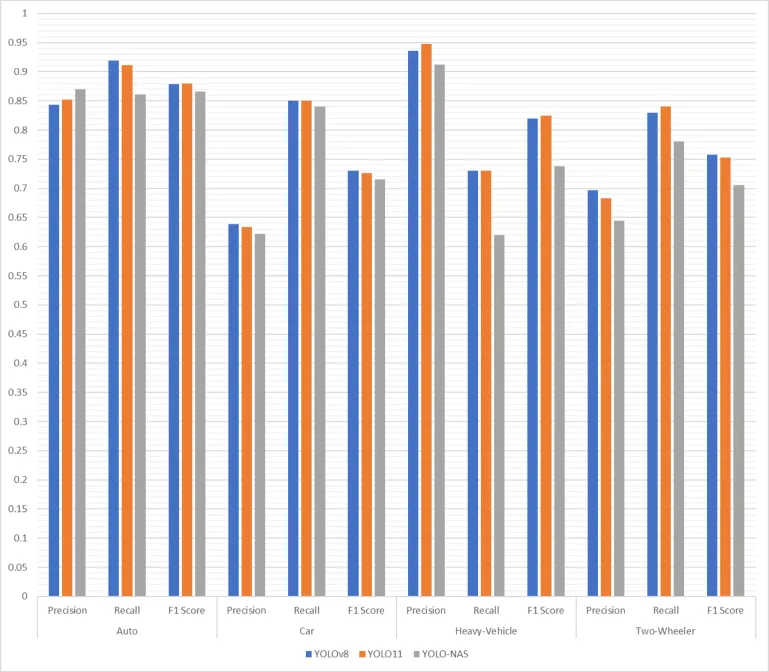
Precision: Precision measures how accurate the positive detections made by the model is. Precision for each class can be defined as:

Precision(class) = TP(class) / Sum(Predicted(class)), where TP is true positives and class ∈ [auto, car, heavy-vehicle, two-wheeler]

Recall: The Recall of each class is the measure of how effectively the model is able to detect the relevant instances of that class. It can be defined as

Recall(class) = TP(class) / Sum(True(class)), where TP is true positives and class ∈ [auto, car, heavy-vehicle, two-wheeler]

F1 Score: F1 score of a class is used to evaluate the overall performance of a model for that class. Even though it is generally used for classification models, we are calculating this as we have all the required data points. The F1 score for a class is defined as the harmonic mean of precision and recall.

F1(class)= 2*Precision(class)*Recall(class) / Precision(class)+Recall(class), where TP is true positives and class ∈ [auto, car, heavy-vehicle, two-wheeler]

The class wise metrics are given below.

YOLO-model-class-metrics.webp

Source: Random Walk

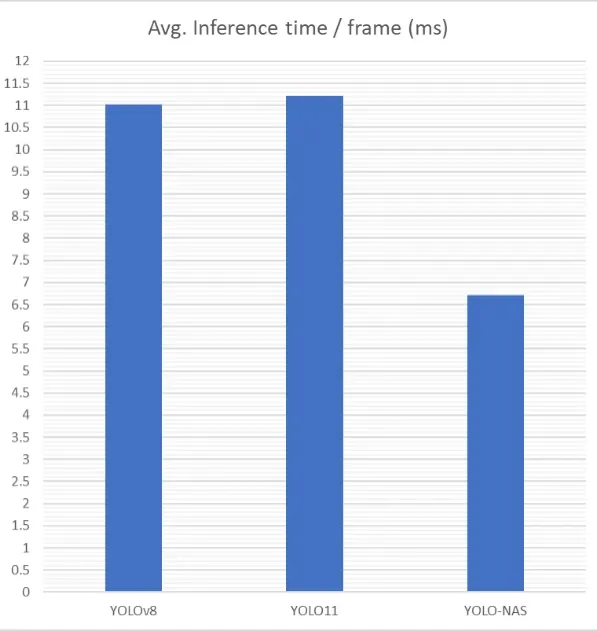
Inference Speed: To compare the inference speed of the three models, we tested each of them against a 3-minute footage containing 2160 frames. From this, the average inference time per frame calculated. The result has been shown below.

YOLO average inference time1.webp

Source: Random Walk

Which YOLO Model to Choose?

From our experiments, we can see the areas in which each model excels.

  • YOLOv8 and YOLO11 both give higher accuracies, with YOLO11 giving a 0.6% higher mAP and a 0.2% higher accuracy while also taking around an extra 0.2ms per frame more to perform the inference.

  • YOLO-NAS excels at producing speedy inferences at the cost of accuracy. YOLO-NAS is 1.64x faster than YOLOv8 and 1.67x faster than YOLO11, with a drop of 1.7% and 2.3% mAP respectively.

  • If detection speed is paramount, with less focus on quality of detections, YOLO-NAS is the best option. But if accuracy is important, either YOLOv8 or YOLO11 can be chosen depending on which fits the solution best.

The choice of model depends on the problem that needs to be solved. Also keep in mind that these numbers are not universal and can vary depending on different factors including the dataset, number of epochs trained, model scale and testing environment. It is best to research and experiment with different models before choosing one.

Licensing

YOLOv8 & YOLO11: Ultralytics distributes both YOLOv8 and YOLO11 with AGPL 3.0 license, which means they are open to commercial use, modification and distribution under the condition that the source code of subsequent work also need to be distributed under the same license. If the source code needs to be kept confidential, purchase of an enterprise license from Ultralytics is required.

YOLO-NAS: Super Gradients is created and released under an Apache 2.0 license, but the repository has another license file for YOLO-NAS which prohibits reselling, leasing, sublicensing or providing managed services of the software without prior written consent from Deci AI. There have been no updates on this situation since the acquisition of Deci AI by NVIDIA, and all links related to Deci AI are being redirected to NVIDIA’s landing page.

Resources for training can be found at:

Related Blogs

Edge System Monitoring: The Key to Managing Distributed AI Infrastructure at Scale

Managing thousands of distributed computing devices, each handling critical real-time data, presents a significant challenge: ensuring seamless operation, robust security, and consistent performance across the entire network. As these systems grow in scale and complexity, traditional monitoring methods often fall short, leaving organizations vulnerable to inefficiencies, security breaches, and performance bottlenecks. Edge system monitoring emerges as a transformative solution, offering real-time visibility, proactive issue detection, and enhanced security to help businesses maintain control over their distributed infrastructure.

Edge System Monitoring: The Key to Managing Distributed AI Infrastructure at Scale

The Intersection of Computer Vision and Immersive Technologies in AR/VR

In recent years, computer vision has transformed the fields of Augmented Reality (AR) and Virtual Reality (VR), enabling new ways for users to interact with digital environments. The AR/VR market, fueled by computer vision advancements, is projected to reach $296.9 billion by 2024, underscoring the impact of these technologies. As computer vision continues to evolve, it will create even more immersive experiences, transforming everything from how we work and learn to how we shop and socialize in virtual spaces. An example of computer vision in AR/VR is Random Walk’s WebXR-powered AI indoor navigation system that transforms how people navigate complex buildings like malls, hotels, or offices. Addressing the common challenges of traditional maps and signage, this AR experience overlays digital directions onto the user’s real-world view via their device's camera. Users select their destination, and AR visual cues—like arrows and information markers—guide them precisely. The system uses SIFT algorithms for computer vision to detect and track distinctive features in the environment, ensuring accurate localization as users move. Accessible through web browsers, this solution offers a cost-effective, adaptable approach to real-world navigation challenges.

The Intersection of Computer Vision and Immersive Technologies in AR/VR

The Great AI Detective Games: YOLOv8 vs YOLOv11

Meet our two star detectives at the YOLO Detective Agency: the seasoned veteran Detective YOLOv8 (68M neural connections) and the efficient rookie Detective YOLOv11 (60M neural pathways). Today, they're facing their ultimate challenge: finding Waldo in a series of increasingly complex scenes.

The Great AI Detective Games: YOLOv8 vs YOLOv11

AI-Powered vs. Traditional Sponsorship Monitoring: Which is Better?

Picture this: You, a brand manager, are at a packed stadium, the crowd's roaring, and suddenly you spot your brand's logo flashing across the giant screen. Your heart races, but then a nagging question hits you: "How do I know if this sponsorship is actually worth the investment?" As brands invest millions in sponsorships, the need for accurate, timely, and insightful monitoring has never been greater. But here's the million-dollar question: Is the traditional approach to sponsorship monitoring still cutting it, or is AI-powered monitoring the new MVP? Let's see how these two methods stack up against each other for brand detection in the high-stakes arena of sports sponsorship.

AI-Powered vs. Traditional Sponsorship Monitoring: Which is Better?

Spatial Computing: The Future of User Interaction

Spatial computing is emerging as a transformative force in digital innovation, enhancing performance by integrating virtual experiences into the physical world. While companies like Microsoft and Meta have made significant strides in this space, Apple’s launch of the Apple Vision Pro AR/VR headset signals a pivotal moment for the technology. This emerging field combines elements of augmented reality (AR), virtual reality (VR), and mixed reality (MR) with advanced sensor technologies and artificial intelligence to create a blend between the physical and digital worlds. This shift demands a new multimodal interaction paradigm and supporting infrastructure to connect data with larger physical dimensions.

Spatial Computing: The Future of User Interaction
Edge System Monitoring: The Key to Managing Distributed AI Infrastructure at Scale

Edge System Monitoring: The Key to Managing Distributed AI Infrastructure at Scale

Managing thousands of distributed computing devices, each handling critical real-time data, presents a significant challenge: ensuring seamless operation, robust security, and consistent performance across the entire network. As these systems grow in scale and complexity, traditional monitoring methods often fall short, leaving organizations vulnerable to inefficiencies, security breaches, and performance bottlenecks. Edge system monitoring emerges as a transformative solution, offering real-time visibility, proactive issue detection, and enhanced security to help businesses maintain control over their distributed infrastructure.

The Intersection of Computer Vision and Immersive Technologies in AR/VR

The Intersection of Computer Vision and Immersive Technologies in AR/VR

In recent years, computer vision has transformed the fields of Augmented Reality (AR) and Virtual Reality (VR), enabling new ways for users to interact with digital environments. The AR/VR market, fueled by computer vision advancements, is projected to reach $296.9 billion by 2024, underscoring the impact of these technologies. As computer vision continues to evolve, it will create even more immersive experiences, transforming everything from how we work and learn to how we shop and socialize in virtual spaces. An example of computer vision in AR/VR is Random Walk’s WebXR-powered AI indoor navigation system that transforms how people navigate complex buildings like malls, hotels, or offices. Addressing the common challenges of traditional maps and signage, this AR experience overlays digital directions onto the user’s real-world view via their device's camera. Users select their destination, and AR visual cues—like arrows and information markers—guide them precisely. The system uses SIFT algorithms for computer vision to detect and track distinctive features in the environment, ensuring accurate localization as users move. Accessible through web browsers, this solution offers a cost-effective, adaptable approach to real-world navigation challenges.

The Great AI Detective Games: YOLOv8 vs YOLOv11

The Great AI Detective Games: YOLOv8 vs YOLOv11

Meet our two star detectives at the YOLO Detective Agency: the seasoned veteran Detective YOLOv8 (68M neural connections) and the efficient rookie Detective YOLOv11 (60M neural pathways). Today, they're facing their ultimate challenge: finding Waldo in a series of increasingly complex scenes.

AI-Powered vs. Traditional Sponsorship Monitoring: Which is Better?

AI-Powered vs. Traditional Sponsorship Monitoring: Which is Better?

Picture this: You, a brand manager, are at a packed stadium, the crowd's roaring, and suddenly you spot your brand's logo flashing across the giant screen. Your heart races, but then a nagging question hits you: "How do I know if this sponsorship is actually worth the investment?" As brands invest millions in sponsorships, the need for accurate, timely, and insightful monitoring has never been greater. But here's the million-dollar question: Is the traditional approach to sponsorship monitoring still cutting it, or is AI-powered monitoring the new MVP? Let's see how these two methods stack up against each other for brand detection in the high-stakes arena of sports sponsorship.

Spatial Computing: The Future of User Interaction

Spatial Computing: The Future of User Interaction

Spatial computing is emerging as a transformative force in digital innovation, enhancing performance by integrating virtual experiences into the physical world. While companies like Microsoft and Meta have made significant strides in this space, Apple’s launch of the Apple Vision Pro AR/VR headset signals a pivotal moment for the technology. This emerging field combines elements of augmented reality (AR), virtual reality (VR), and mixed reality (MR) with advanced sensor technologies and artificial intelligence to create a blend between the physical and digital worlds. This shift demands a new multimodal interaction paradigm and supporting infrastructure to connect data with larger physical dimensions.

Additional

Your Random Walk Towards AI Begins Now