The Random Walk Blog

2025-01-16

How Can Enterprises Benefit from Generative AI in Data Visualization

How Can Enterprises Benefit from Generative AI in Data Visualization

It’s New Year’s Eve, and John, a data analyst, is finishing up a fun party with his friends. Feeling tired and eager to relax, he looks forward to unwinding. But as he checks his phone, a message from his manager pops up: “Is the dashboard ready for tomorrow’s sales meeting?”

John’s heart sinks. The meeting is in less than 12 hours, and he’s barely started on the dashboard. Without thinking, he quickly types back, “Yes,” hoping he can pull it together somehow. The problem? He’s exhausted, and the thought of combing through a massive 1000-row CSV file to create graphs in Excel or Tableau feels overwhelming.

Just when he starts to panic, he remembers his secret weapon: Fortune Cookie, the AI-assistant that can turn data into insightful data visualizations in no time. Relieved, John knows he doesn’t have to break a sweat. Fortune Cookie has him covered, and the dashboard will be ready in no time.

What is Fortune Cookie?

In a nutshell, Fortune Cookie is your AI assistant for delivering data insights. Simply ask questions about your data and receive clear answers. When you need visual clarity, just request a graph and watch as your data transforms into compelling visualizations – all through natural conversation.

How Fortune Cookie Uses RAG (Retrieval-Augmented Generation)?

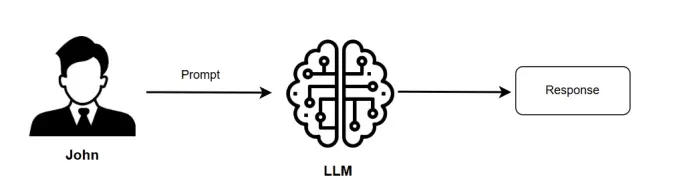
Traditional language models are trained on vast amounts of text data to generate human-like responses. But these models have a major drawback - they generate responses based solely on the knowledge they were trained on. This can lead to issues such as hallucination (providing outdated or inaccurate information), biases, and a lack of source attribution.

This is where RAG (Retrieval-Augmented Generation) can be useful. RAG operates by dynamically pulling in relevant information from external databases or documents at the time of text generation; hence providing more comprehensive, context-aware responses.

traditional llm architecure.webp

Traditional LLM architecture

RAG based llm architecture.webp

RAG-based LLM Architecture

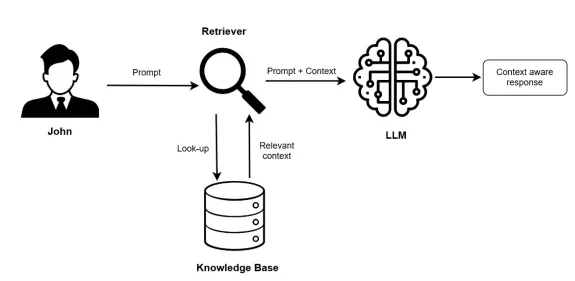
With RAG in play, John doesn’t have to lose sleep over his LLM pulling wild stunts like reporting total revenue for 2022 when his company didn’t even exist.

The Old School Way of Data Visualization

Traditionally, analysts like John face 2 main issues while generating data visualizations.

Data-Cleaning and Preparation

Data formatting and preparation to answer specific queries is one of the biggest challenges analysts face. However, Gen AI makes this process much quicker and easier. Analysts typically need to build data-cleaning pipelines to handle categorical and numerical columns. Moreover, data-cleaning involves multiple steps, such as handling missing values and removing irrelevant columns, etc. Doing this manually can be time-consuming. Fortunately, Fortune Cookie automates these tasks, handling the necessary data-cleaning steps as soon as you upload your data.

Selecting a Data Visualization

Another challenge an analyst comes across is deciding which data visualization to use. Data analysts have to format and prepare the data for visualization soon after choosing a type of data visualization. Selecting the right type of data visualization is crucial because it impacts how effectively the data story is communicated to the audience. Different types of data require different visual representations, such as bar charts, line graphs, pie charts, or scatter plots. Fortune Cookie automatically selects the most suitable graph for a given user query, while also offering the flexibility to explore alternative graph options for the same query. For line graphs, Fortune Cookie can decide when the data has a linear relationship between the variables and when the relationship is a curve, automating smoothing. The extent of the data values to be visualized can also be configured.

Why are Data Visualizations Important for Enterprises

Makes Data More Comprehensible: Data visualizations convert complicated datasets into graphical formats, making it simpler for audiences to identify insights. The human brain responds quickly to visual diagrams instead of text data. These charts help make fast decisions and grow the business simultaneously.

Democratized Insights: Visual graphs enable a broader range of users within a business, including non-technical individuals, to access, explore, and derive insights from the data.

Where Fortune Cookie Enters The Scene

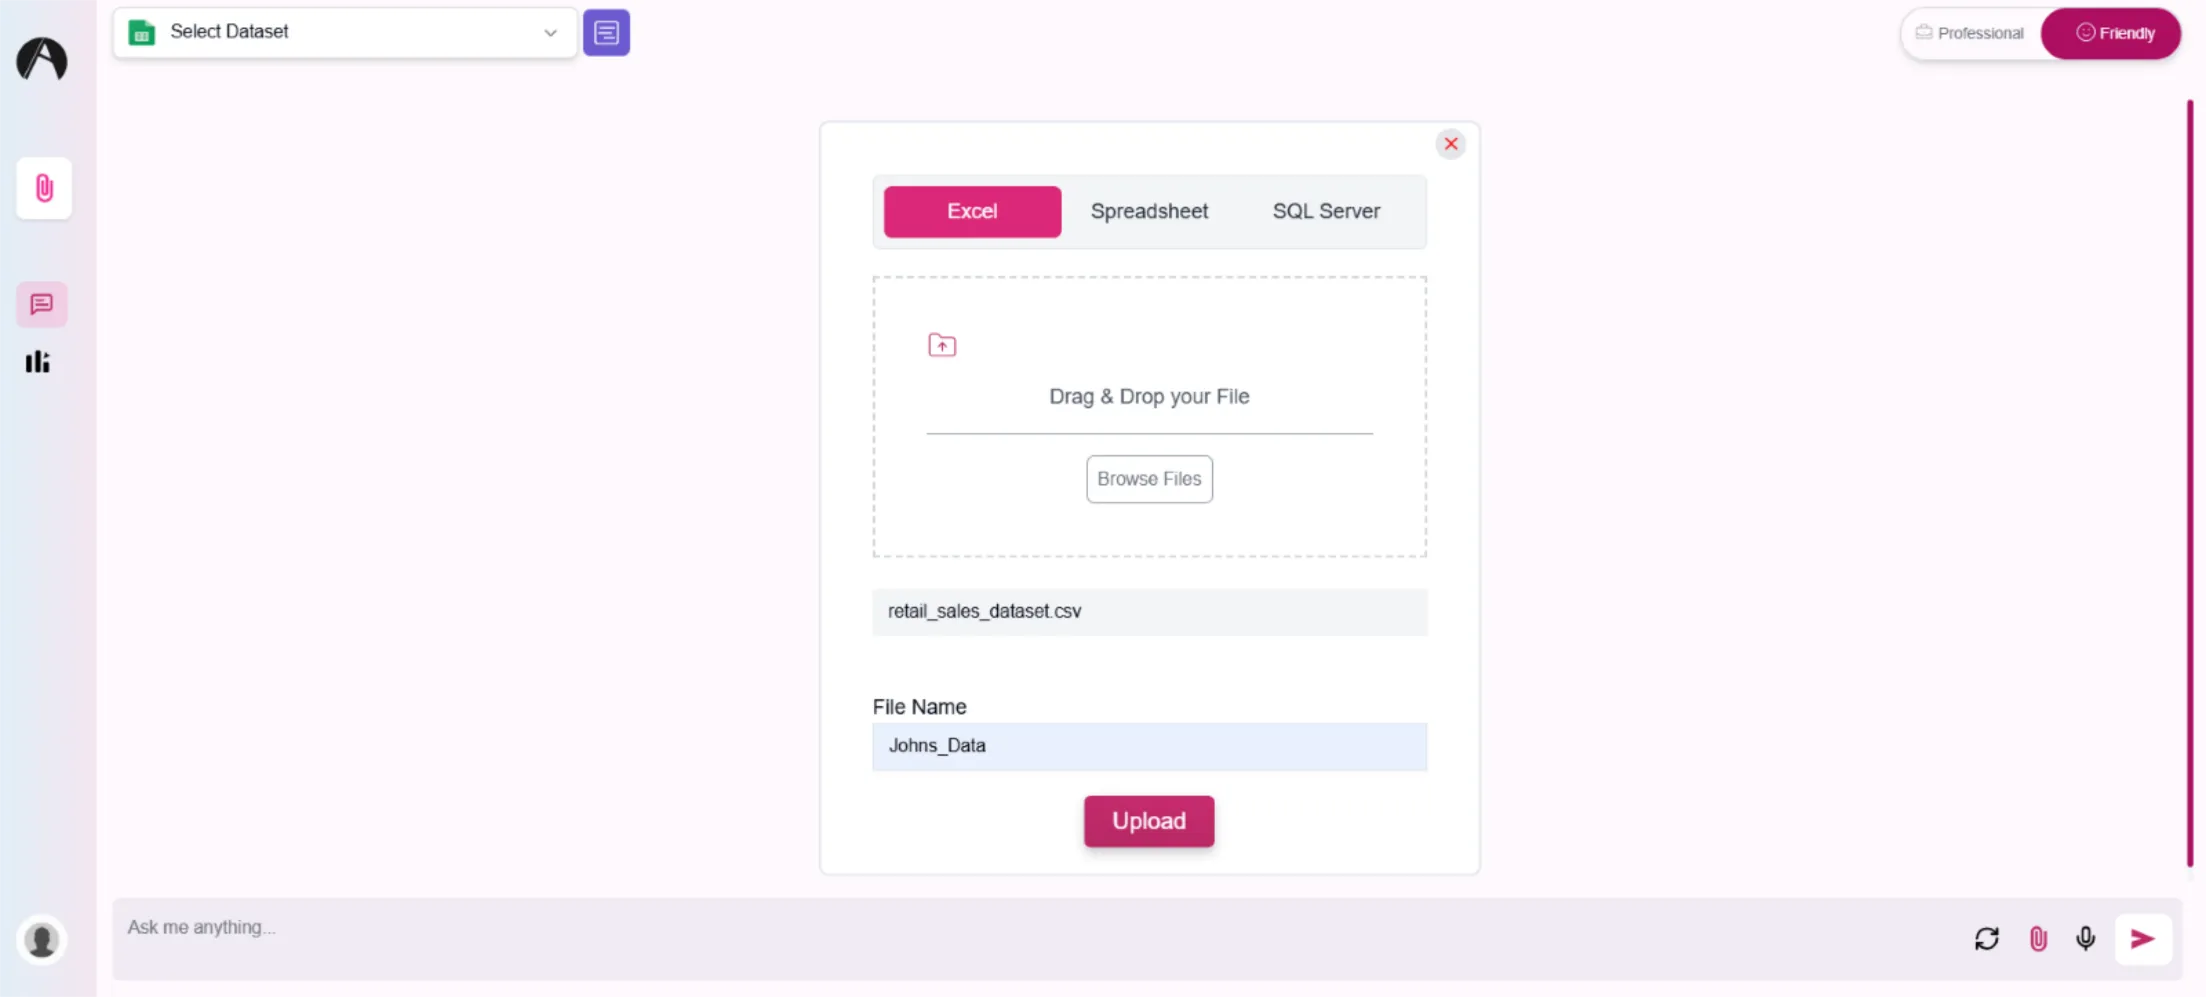
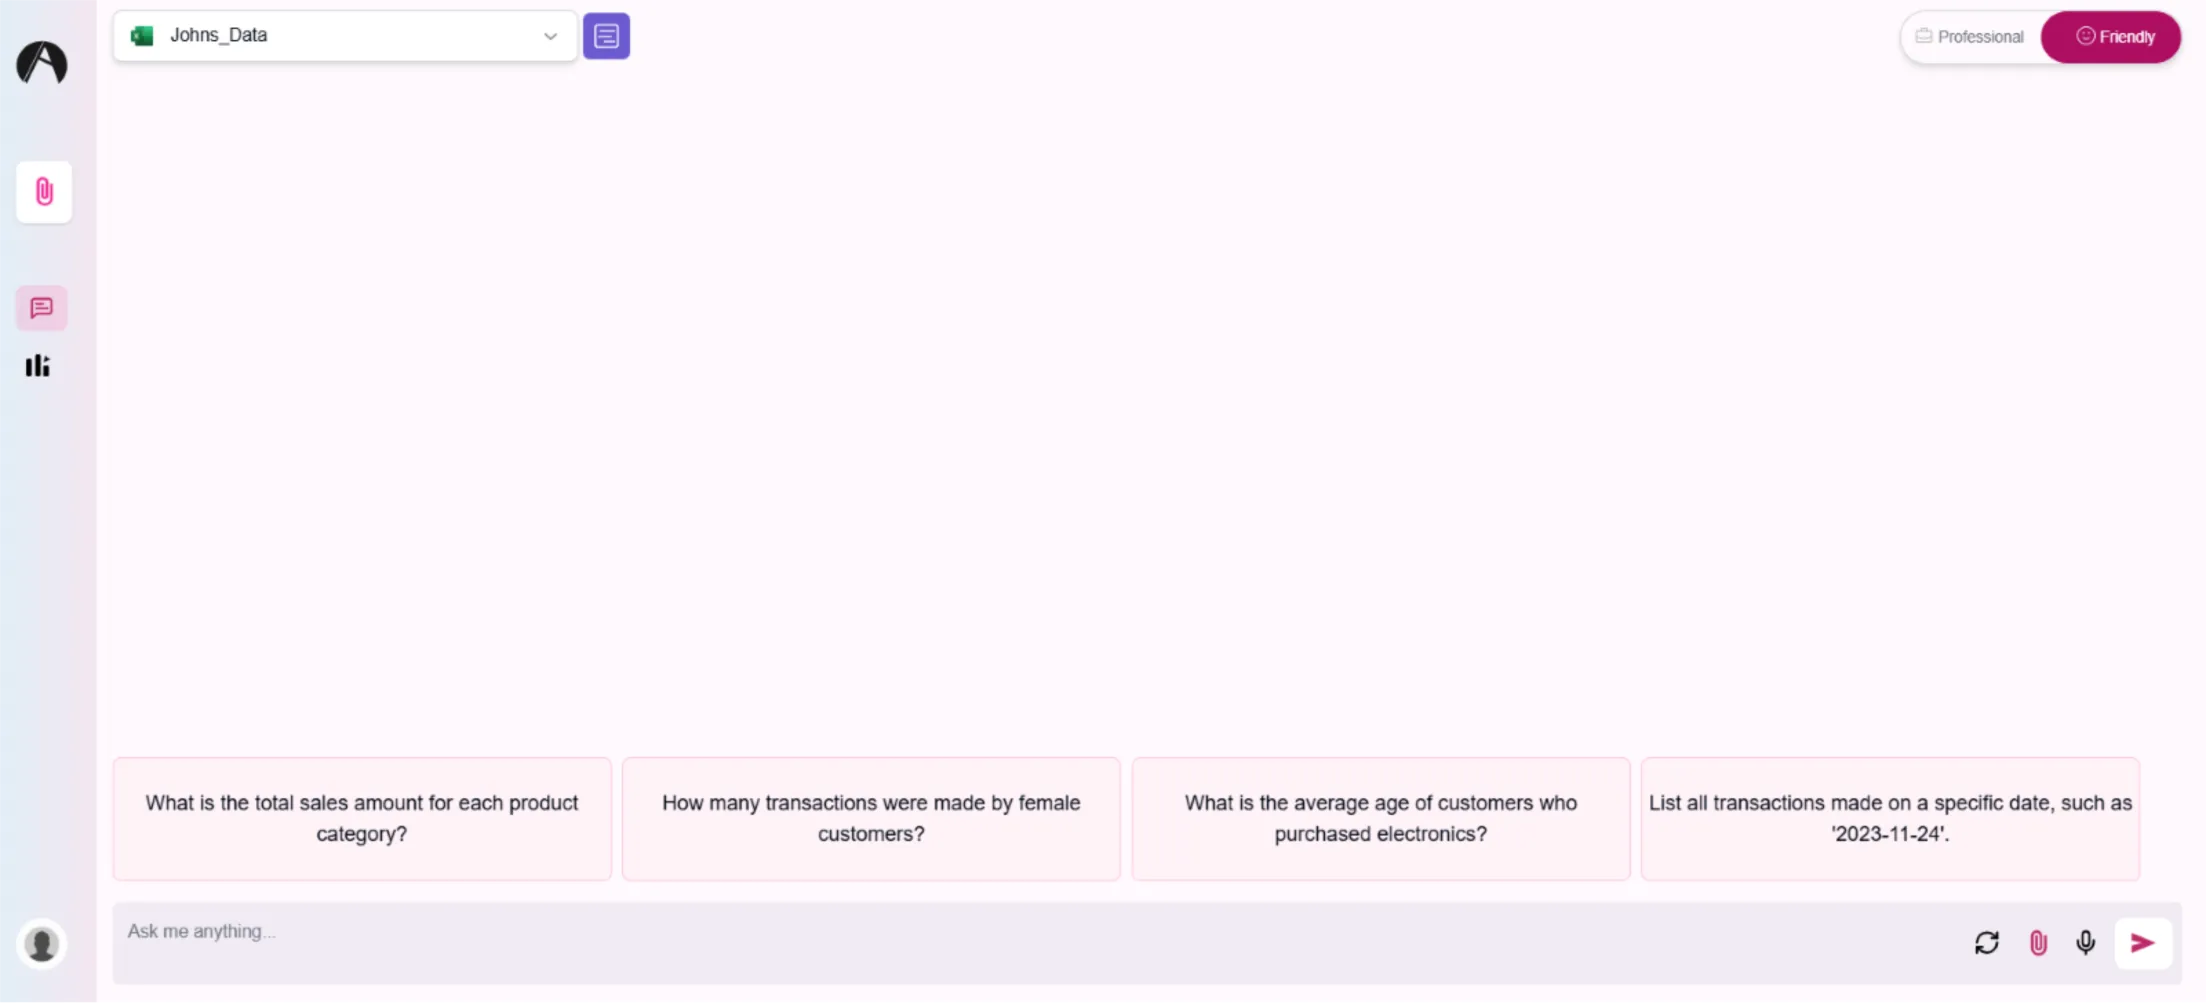
John uploads his CSV file to Fortune Cookie. Once the file is uploaded, he can easily ask specific questions about last year’s sales, such as:

  • "Give me the monthly sales trend" or

  • "Total quantity sold by product category"

But that’s not all. John also has the option to create dynamic dashboards with vibrant, colourful charts. By using Fortune Cookie's "Viz" feature, John simply enters a query, and the system automatically generates the most appropriate chart to visualize the data. The Viz feature enables John to create multiple dashboards and visualize multiple datasets.

No more wasting hours sifting through columns, stressing over which graph to choose, or figuring out the best way to assign and align axes. Fortune Cookie handles it all, ensuring John can focus on what really matters: delivering the insights, not spending time on tedious setup. Below given are the example of Fortune Cookie's dashboard.

Fortune-Cookie-dashboard-1.webp

Fortune-Cookie-dashboard-2.webp

Fortune-Cookie-dashboard-3.webp

Source: Random Walk

With Fortune Cookie, you no longer need to build basic dashboards or handle repetitive tasks like data cleansing or statistical analysis. Fortune Cookie can automatically create data visualizations and dashboards according to prompts given by the user and minimize human intervention.  Hence you don’t have to be an expert analyst like John or stress about the time crunch before your sales meeting – Fortune Cookie has got you covered.

Get in touch with us today to schedule your consultation and discover how Random Walk can empower your organization to harness the full potential of AI.

Related Blogs

I Built an AI Agent From Scratch—Here’s What I Learned

I’ve worked with LangChain. I’ve played with LlamaIndex. They’re great—until they aren’t.

I Built an AI Agent From Scratch—Here’s What I Learned

Streamlining File Management with MindFolder’s Intelligent Edge

Brain rot, the 2024 Word of the Year, perfectly encapsulates the overwhelming state of mental fatigue caused by endless information overload—a challenge faced by individuals and businesses alike in today’s fast-paced digital world. At its core, this term highlights the need for streamlined systems that simplify the way we interact with data and files.

Streamlining File Management with MindFolder’s Intelligent Edge

Refining and Creating Data Visualizations with LIDA and AI Fortune Cookie

Data visualization and storytelling are critical for making sense of today’s data-rich world. Whether you’re an analyst, a researcher, or a business leader, translating raw data into actionable insights often hinges on effective tools. Two innovative platforms that elevate this process are Microsoft’s LIDA and our RAG-enhanced data visualization platform using gen AI, AI Fortune Cookie. While LIDA specializes in refining and enhancing infographics, Fortune Cookie transforms disparate datasets into cohesive dashboards with the power of natural language prompts. Together, they form a powerful combination for visual storytelling and data-driven decision-making.

Refining and Creating Data Visualizations with LIDA and AI Fortune Cookie

1-bit LLMs: The Future of Efficient and Accessible Enterprise AI

As data grows, enterprises face challenges in managing their knowledge systems. While Large Language Models (LLMs) like GPT-4 excel in understanding and generating text, they require substantial computational resources, often needing hundreds of gigabytes of memory and costly GPU hardware. This poses a significant barrier for many organizations, alongside concerns about data privacy and operational costs. As a result, many enterprises find it difficult to utilize the AI capabilities essential for staying competitive, as current LLMs are often technically and financially out of reach.

1-bit LLMs: The Future of Efficient and Accessible Enterprise AI

GuideLine: RAG-Enhanced HRMS for Smarter Workflows

Human Resources Management Systems (HRMS) often struggle with efficiently managing and retrieving valuable information from unstructured data, such as policy documents, emails, and PDFs, while ensuring the integration of structured data like employee records. This challenge limits the ability to provide contextually relevant, accurate, and easily accessible information to employees, hindering overall efficiency and knowledge management within organizations.

GuideLine: RAG-Enhanced HRMS for Smarter Workflows
I Built an AI Agent From Scratch—Here’s What I Learned

I Built an AI Agent From Scratch—Here’s What I Learned

I’ve worked with LangChain. I’ve played with LlamaIndex. They’re great—until they aren’t.

Streamlining File Management with MindFolder’s Intelligent Edge

Streamlining File Management with MindFolder’s Intelligent Edge

Brain rot, the 2024 Word of the Year, perfectly encapsulates the overwhelming state of mental fatigue caused by endless information overload—a challenge faced by individuals and businesses alike in today’s fast-paced digital world. At its core, this term highlights the need for streamlined systems that simplify the way we interact with data and files.

Refining and Creating Data Visualizations with LIDA and AI Fortune Cookie

Refining and Creating Data Visualizations with LIDA and AI Fortune Cookie

Data visualization and storytelling are critical for making sense of today’s data-rich world. Whether you’re an analyst, a researcher, or a business leader, translating raw data into actionable insights often hinges on effective tools. Two innovative platforms that elevate this process are Microsoft’s LIDA and our RAG-enhanced data visualization platform using gen AI, AI Fortune Cookie. While LIDA specializes in refining and enhancing infographics, Fortune Cookie transforms disparate datasets into cohesive dashboards with the power of natural language prompts. Together, they form a powerful combination for visual storytelling and data-driven decision-making.

1-bit LLMs: The Future of Efficient and Accessible Enterprise AI

1-bit LLMs: The Future of Efficient and Accessible Enterprise AI

As data grows, enterprises face challenges in managing their knowledge systems. While Large Language Models (LLMs) like GPT-4 excel in understanding and generating text, they require substantial computational resources, often needing hundreds of gigabytes of memory and costly GPU hardware. This poses a significant barrier for many organizations, alongside concerns about data privacy and operational costs. As a result, many enterprises find it difficult to utilize the AI capabilities essential for staying competitive, as current LLMs are often technically and financially out of reach.

GuideLine: RAG-Enhanced HRMS for Smarter Workflows

GuideLine: RAG-Enhanced HRMS for Smarter Workflows

Human Resources Management Systems (HRMS) often struggle with efficiently managing and retrieving valuable information from unstructured data, such as policy documents, emails, and PDFs, while ensuring the integration of structured data like employee records. This challenge limits the ability to provide contextually relevant, accurate, and easily accessible information to employees, hindering overall efficiency and knowledge management within organizations.

Additional

Your Random Walk Towards AI Begins Now